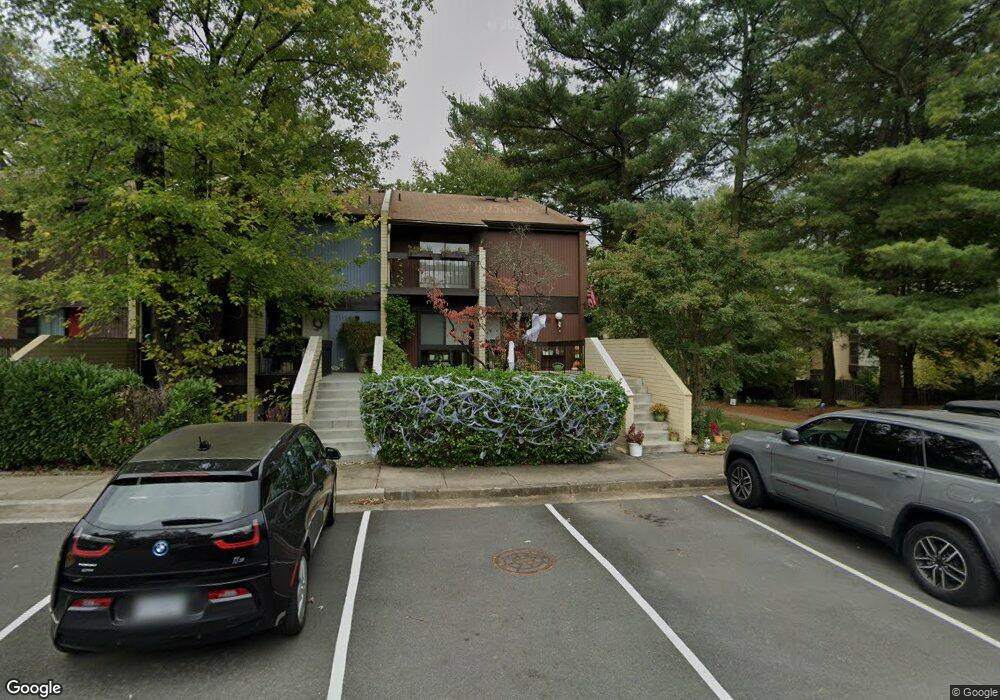
11132 Saffold Way Reston, VA 20190
Tall Oaks/Uplands NeighborhoodEstimated Value: $625,971 - $658,000
3
Beds
3
Baths
1,398
Sq Ft
$462/Sq Ft
Est. Value
About This Home
This home is located at 11132 Saffold Way, Reston, VA 20190 and is currently estimated at $646,493, approximately $462 per square foot. 11132 Saffold Way is a home located in Fairfax County with nearby schools including Forest Edge Elementary, Langston Hughes Middle School, and South Lakes High School.
Ownership History
Date
Name
Owned For
Owner Type
Purchase Details
Closed on
May 6, 2005
Sold by
Koppelman Andrea L
Bought by
Hoilman Chad D
Current Estimated Value
Home Financials for this Owner
Home Financials are based on the most recent Mortgage that was taken out on this home.
Original Mortgage
$361,700
Outstanding Balance
$190,648
Interest Rate
6.01%
Mortgage Type
New Conventional
Estimated Equity
$455,845
Purchase Details
Closed on
Sep 30, 2002
Sold by
Carter Lenwood M
Bought by
Koppelman Andrea L
Home Financials for this Owner
Home Financials are based on the most recent Mortgage that was taken out on this home.
Original Mortgage
$199,600
Interest Rate
6.25%
Purchase Details
Closed on
Apr 28, 1997
Sold by
Cheung Albert K
Bought by
Carter Lenwood M
Home Financials for this Owner
Home Financials are based on the most recent Mortgage that was taken out on this home.
Original Mortgage
$115,200
Interest Rate
7.77%
Mortgage Type
New Conventional
Create a Home Valuation Report for This Property
The Home Valuation Report is an in-depth analysis detailing your home's value as well as a comparison with similar homes in the area
Home Values in the Area
Average Home Value in this Area
Purchase History
| Date | Buyer | Sale Price | Title Company |
|---|---|---|---|
| Hoilman Chad D | $452,150 | -- | |
| Koppelman Andrea L | $249,500 | -- | |
| Carter Lenwood M | $144,000 | -- |
Source: Public Records
Mortgage History
| Date | Status | Borrower | Loan Amount |
|---|---|---|---|
| Open | Hoilman Chad D | $361,700 | |
| Previous Owner | Koppelman Andrea L | $199,600 | |
| Previous Owner | Carter Lenwood M | $115,200 |
Source: Public Records
Tax History
| Year | Tax Paid | Tax Assessment Tax Assessment Total Assessment is a certain percentage of the fair market value that is determined by local assessors to be the total taxable value of land and additions on the property. | Land | Improvement |
|---|---|---|---|---|
| 2025 | $6,378 | $571,950 | $170,000 | $401,950 |
| 2024 | $6,378 | $529,080 | $155,000 | $374,080 |
| 2023 | $6,137 | $522,110 | $155,000 | $367,110 |
| 2022 | $5,633 | $492,610 | $145,000 | $347,610 |
| 2021 | $5,257 | $430,700 | $130,000 | $300,700 |
| 2020 | $4,984 | $405,060 | $120,000 | $285,060 |
| 2019 | $5,020 | $408,000 | $120,000 | $288,000 |
| 2018 | $4,692 | $408,000 | $120,000 | $288,000 |
| 2017 | $4,929 | $408,000 | $120,000 | $288,000 |
| 2016 | $4,572 | $379,290 | $105,000 | $274,290 |
Source: Public Records
Map
Nearby Homes
- 11110 Saffold Way
- 1331 Deep Run Ln
- 1410 Northgate Square Unit 10/1A
- 1427 Northgate Square Unit 27/22B
- 1422 Northgate Square Unit 22/1A
- 1327 Murray Downs Way
- 1411 Aldenham Ln
- 1552 Northgate Square Unit 12B
- 11212 Bradbury Ln
- 11186 Longwood Grove Dr
- 1546 Northgate Square Unit 21C
- 1532 Northgate Square Unit 12A
- 10812 Crippen Vale Ct
- 1257 New Bedford Ln
- 1419 Belcastle Ct
- 1314 Garden Wall Cir Unit C
- 11400 Washington Plaza W Unit 1303
- 11400 Washington Plaza W Unit 103
- 1334 Garden Wall Cir Unit "E"
- 1610 Fellowship Square
- 11134 Saffold Way
- 11138 Saffold Way
- 11140 Saffold Way
- 11142 Saffold Way
- 11090 Saffold Way
- 11144 Saffold Way
- 11130 Saffold Way
- 11128 Saffold Way
- 11170 Saffold Way
- 11168 Saffold Way
- 11126 Saffold Way
- 11172 Saffold Way
- 11166 Saffold Way
- 11088 Saffold Way
- 11124 Saffold Way
- 11164 Saffold Way
- 11092 Saffold Way
- 11146 Saffold Way
- 11162 Saffold Way
- 11086 Saffold Way
Your Personal Tour Guide
Ask me questions while you tour the home.