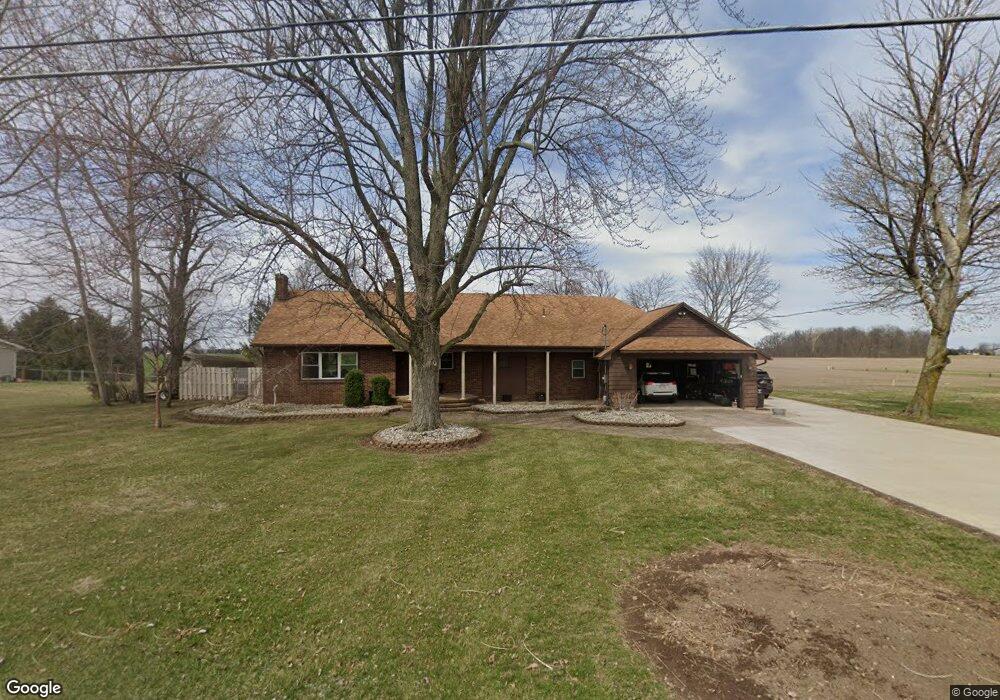
11134 State Route 12 Columbus Grove, OH 45830
Estimated Value: $249,419 - $327,000
--
Bed
2
Baths
1,540
Sq Ft
$187/Sq Ft
Est. Value
About This Home
This home is located at 11134 State Route 12, Columbus Grove, OH 45830 and is currently estimated at $288,605, approximately $187 per square foot. 11134 State Route 12 is a home located in Putnam County with nearby schools including Columbus Grove Elementary School, Columbus Grove Middle School, and Columbus Grove High School.
Ownership History
Date
Name
Owned For
Owner Type
Purchase Details
Closed on
Jul 19, 2021
Sold by
Kaufman Rogert T and Kaufman Jacqueline K
Bought by
Diller Clay D and Dieler Rachel L
Current Estimated Value
Home Financials for this Owner
Home Financials are based on the most recent Mortgage that was taken out on this home.
Original Mortgage
$220,000
Outstanding Balance
$199,920
Interest Rate
3%
Mortgage Type
New Conventional
Estimated Equity
$88,685
Purchase Details
Closed on
Apr 22, 2020
Sold by
A & T Ruthman Llc
Bought by
Kaufman Roger T and Kaufman Jacqueline K
Purchase Details
Closed on
May 15, 2008
Sold by
Miller Jack J and Miller Kimberly J
Bought by
Kaufman Roger T and Kaufman Jacqueline K
Home Financials for this Owner
Home Financials are based on the most recent Mortgage that was taken out on this home.
Original Mortgage
$152,000
Interest Rate
5.93%
Mortgage Type
New Conventional
Create a Home Valuation Report for This Property
The Home Valuation Report is an in-depth analysis detailing your home's value as well as a comparison with similar homes in the area
Home Values in the Area
Average Home Value in this Area
Purchase History
| Date | Buyer | Sale Price | Title Company |
|---|---|---|---|
| Diller Clay D | $245,000 | None Available | |
| Kaufman Roger T | $3,000 | None Available | |
| Kaufman Roger T | $160,000 | Attorney |
Source: Public Records
Mortgage History
| Date | Status | Borrower | Loan Amount |
|---|---|---|---|
| Open | Diller Clay D | $220,000 | |
| Previous Owner | Kaufman Roger T | $152,000 |
Source: Public Records
Tax History Compared to Growth
Tax History
| Year | Tax Paid | Tax Assessment Tax Assessment Total Assessment is a certain percentage of the fair market value that is determined by local assessors to be the total taxable value of land and additions on the property. | Land | Improvement |
|---|---|---|---|---|
| 2024 | $2,355 | $74,720 | $4,220 | $70,500 |
| 2023 | $2,496 | $43,030 | $3,330 | $39,700 |
| 2022 | $1,652 | $43,030 | $3,329 | $39,701 |
| 2021 | $1,537 | $43,030 | $3,329 | $39,701 |
| 2020 | $1,525 | $38,470 | $2,800 | $35,670 |
| 2019 | $1,342 | $38,330 | $3,000 | $35,330 |
| 2018 | $1,339 | $38,330 | $3,000 | $35,330 |
| 2017 | $1,320 | $38,330 | $3,000 | $35,330 |
| 2016 | $1,320 | $38,470 | $2,800 | $35,670 |
| 2015 | $1,327 | $38,470 | $2,800 | $35,670 |
| 2014 | $1,340 | $38,470 | $2,800 | $35,670 |
| 2013 | $1,337 | $38,470 | $2,800 | $35,670 |
Source: Public Records
Map
Nearby Homes
- 308 Delphos Rd
- 11059 Ottawa Rd
- 205 S Broadway St
- 204 S Broadway St
- 209 Willow Bend Dr
- 147 Elm St
- 148 S Water St
- 6585 Ottawa Rd
- 15105 Road 15m
- 201 Wall St
- 309 Wall St
- 300 Sweaney Ave
- 220 Parklane Dr
- 00000 Ohio 696
- 000 Ohio 696
- 0000 Ohio 696
- 17429 Road 5
- 704 Sherman St
- 208 E Monroe St
- 8160 Columbus Grove-Bluffton Rd
- 11134 Ohio 12
- 11162 Ohio 12
- 11162 State Route 12
- 11145 State Route 12
- 11107 State Route 12
- 11088 State Route 12
- 11185 State Route 12
- 11081 State Route 12
- 11194 State Route 12
- 11080 State Route 12
- 11062 State Route 12
- 11065 State Route 12
- 11209 State Route 12
- 11052 State Route 12
- 11228 State Route 12
- 11245 State Route 12
- 11285 State Route 12
- 10990 State Route 12
- 10964 State Route 12
- 10951 State Route 12