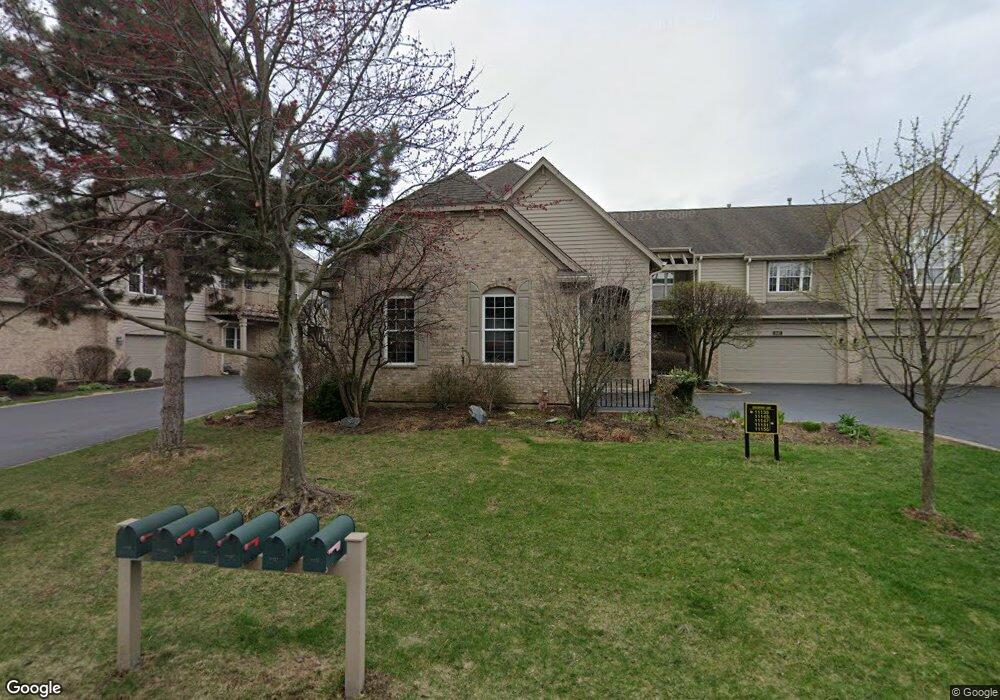
11135 Edgebrook Ln La Grange, IL 60525
Estimated Value: $418,604 - $501,000
2
Beds
2
Baths
1,278
Sq Ft
$373/Sq Ft
Est. Value
About This Home
This home is located at 11135 Edgebrook Ln, La Grange, IL 60525 and is currently estimated at $476,651, approximately $372 per square foot. 11135 Edgebrook Ln is a home located in Cook County with nearby schools including Highlands Elementary School, Highlands Middle School, and Lyons Township High School.
Ownership History
Date
Name
Owned For
Owner Type
Purchase Details
Closed on
Jun 9, 2022
Sold by
Voytas Richard L and Voytas Gale M
Bought by
Richard L Voytas And Gale M Voytas Living Tru and Voytas
Current Estimated Value
Purchase Details
Closed on
Mar 23, 2018
Sold by
Jakicic Catherine
Bought by
Voytas Richard L and Voytas Gale M
Home Financials for this Owner
Home Financials are based on the most recent Mortgage that was taken out on this home.
Original Mortgage
$279,920
Interest Rate
4.75%
Mortgage Type
New Conventional
Purchase Details
Closed on
Dec 30, 2009
Sold by
Haugland Timothy J
Bought by
Jakicic George R and Jakicic Catherine
Purchase Details
Closed on
Sep 5, 2001
Sold by
Lapekas Carrah M
Bought by
Haugland Robert D and Haugland Dorothy J
Purchase Details
Closed on
Jul 1, 1997
Sold by
Donven Homes Inc
Bought by
Robottom Violet L
Create a Home Valuation Report for This Property
The Home Valuation Report is an in-depth analysis detailing your home's value as well as a comparison with similar homes in the area
Home Values in the Area
Average Home Value in this Area
Purchase History
| Date | Buyer | Sale Price | Title Company |
|---|---|---|---|
| Richard L Voytas And Gale M Voytas Living Tru | -- | Koziel John D | |
| Voytas Richard L | $350,000 | Chicago Title | |
| Jakicic George R | $305,000 | Cti | |
| Haugland Robert D | $259,000 | -- | |
| Robottom Violet L | $204,000 | -- |
Source: Public Records
Mortgage History
| Date | Status | Borrower | Loan Amount |
|---|---|---|---|
| Previous Owner | Voytas Richard L | $279,920 |
Source: Public Records
Tax History Compared to Growth
Tax History
| Year | Tax Paid | Tax Assessment Tax Assessment Total Assessment is a certain percentage of the fair market value that is determined by local assessors to be the total taxable value of land and additions on the property. | Land | Improvement |
|---|---|---|---|---|
| 2024 | $7,374 | $38,001 | $4,154 | $33,847 |
| 2023 | $6,787 | $38,001 | $4,154 | $33,847 |
| 2022 | $6,787 | $30,905 | $3,610 | $27,295 |
| 2021 | $7,187 | $30,905 | $3,610 | $27,295 |
| 2020 | $7,077 | $30,905 | $3,610 | $27,295 |
| 2019 | $7,484 | $32,730 | $3,290 | $29,440 |
| 2018 | $4,807 | $32,730 | $3,290 | $29,440 |
| 2017 | $4,591 | $32,730 | $3,290 | $29,440 |
| 2016 | $5,960 | $28,527 | $2,875 | $25,652 |
| 2015 | $6,163 | $28,527 | $2,875 | $25,652 |
| 2014 | $5,951 | $28,527 | $2,875 | $25,652 |
| 2013 | $5,793 | $29,662 | $2,875 | $26,787 |
Source: Public Records
Map
Nearby Homes
- 6213 Edgebrook Ln W
- 6262 Edgebrook Ln E
- 170 Cascade Dr
- 164 Cascade Dr
- 11300 Sequoya Ln
- 6001 Wolf Rd
- 11407 Hiawatha Ln
- 904 Hickory Dr
- 909 Red Oak Dr
- 127 Acacia Cir Unit 505
- 127 Acacia Cir Unit 203
- 111 Acacia Dr Unit 508
- 7445 Willow Springs Rd
- 5913 Timber Trails (Lot 59) Blvd
- 6441 Blackhawk Trail
- 6008 Burr Oak (Lot 129) Dr
- 6814 Joliet Rd Unit 9
- 4 Potawatomie Trail Unit 4
- 6411 Pontiac Dr Unit 3
- 5903 Timber Trails (Lot 54) Blvd
- 11135 Edgebrook Ln Unit A
- 11147 Edgebrook Ln
- 11139 Edgebrook Ln
- 11143 Edgebrook Ln
- 11151 Edgebrook Ln
- 11131 Edgebrook Ln
- 11131 Edgebrook Ln Unit B
- 11155 Edgebrook Ln
- 11127 Edgebrook Ln
- 11123 Edgebrook Ln
- 11159 Edgebrook Ln
- 221 Cascade Dr
- 11140 Edgebrook Ln
- 223 Cascade Dr Unit 4
- 219 Cascade Dr
- 11163 Edgebrook Ln
- 225 Cascade Dr
- 11136 Edgebrook Ln
- 6225 Edgebrook Ln W
- 6227 Edgebrook Ln W