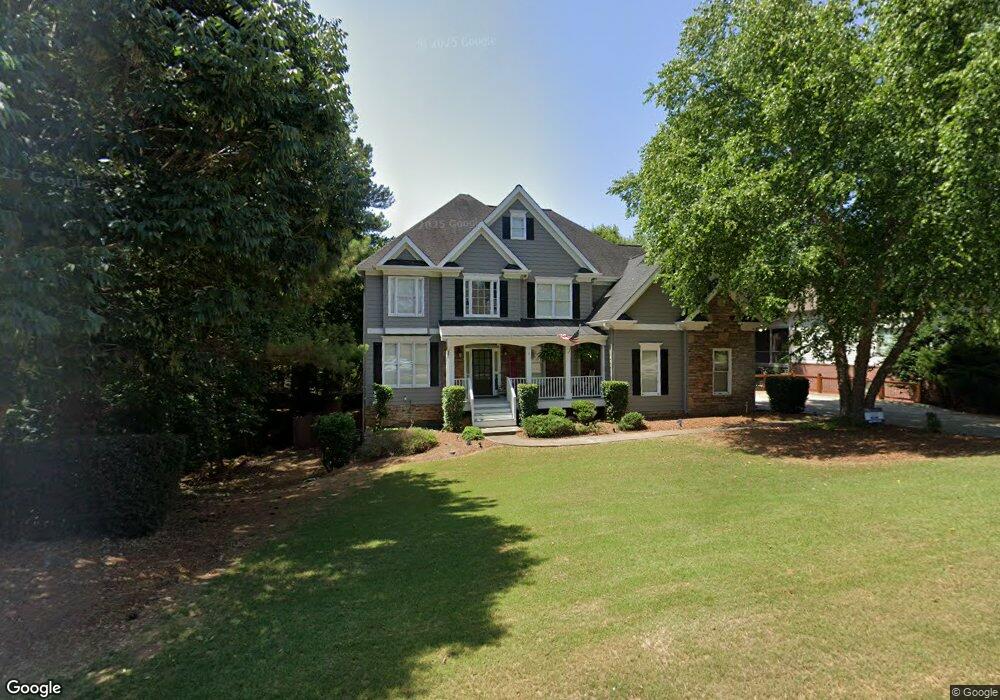
1114 Bridge Mill Ave Canton, GA 30114
Sutallee NeighborhoodEstimated Value: $753,881 - $834,000
7
Beds
5
Baths
4,750
Sq Ft
$167/Sq Ft
Est. Value
About This Home
This home is located at 1114 Bridge Mill Ave, Canton, GA 30114 and is currently estimated at $793,941, approximately $167 per square foot. 1114 Bridge Mill Ave is a home located in Cherokee County with nearby schools including Sixes Elementary School, Freedom Middle School, and Woodstock High School.
Ownership History
Date
Name
Owned For
Owner Type
Purchase Details
Closed on
Feb 25, 2019
Sold by
Stark Patrick A
Bought by
Murphy Kelly Ann
Current Estimated Value
Purchase Details
Closed on
Sep 21, 2001
Sold by
Diee Robert W and Diee Elaine
Bought by
Stark Patrick A and Stark Kelly M
Home Financials for this Owner
Home Financials are based on the most recent Mortgage that was taken out on this home.
Original Mortgage
$232,500
Interest Rate
6.59%
Mortgage Type
New Conventional
Purchase Details
Closed on
Oct 28, 1999
Sold by
Amc Builders Inc
Bought by
Dice Robert W and Dice Elaine
Home Financials for this Owner
Home Financials are based on the most recent Mortgage that was taken out on this home.
Original Mortgage
$234,300
Interest Rate
7.5%
Mortgage Type
New Conventional
Create a Home Valuation Report for This Property
The Home Valuation Report is an in-depth analysis detailing your home's value as well as a comparison with similar homes in the area
Home Values in the Area
Average Home Value in this Area
Purchase History
| Date | Buyer | Sale Price | Title Company |
|---|---|---|---|
| Murphy Kelly Ann | -- | -- | |
| Stark Patrick A | $320,000 | -- | |
| Dice Robert W | $292,900 | -- |
Source: Public Records
Mortgage History
| Date | Status | Borrower | Loan Amount |
|---|---|---|---|
| Previous Owner | Stark Patrick A | $232,500 | |
| Previous Owner | Dice Robert W | $234,300 |
Source: Public Records
Tax History Compared to Growth
Tax History
| Year | Tax Paid | Tax Assessment Tax Assessment Total Assessment is a certain percentage of the fair market value that is determined by local assessors to be the total taxable value of land and additions on the property. | Land | Improvement |
|---|---|---|---|---|
| 2025 | $7,007 | $266,816 | $72,000 | $194,816 |
| 2024 | $6,712 | $258,264 | $56,000 | $202,264 |
| 2023 | $6,259 | $240,840 | $52,000 | $188,840 |
| 2022 | $5,490 | $208,880 | $42,000 | $166,880 |
| 2021 | $5,019 | $176,800 | $30,000 | $146,800 |
| 2020 | $4,757 | $167,400 | $30,000 | $137,400 |
| 2019 | $4,231 | $156,080 | $30,000 | $126,080 |
| 2018 | $4,075 | $148,440 | $30,000 | $118,440 |
| 2017 | $3,977 | $366,200 | $30,000 | $116,480 |
| 2016 | $3,977 | $353,300 | $30,000 | $111,320 |
| 2015 | $3,609 | $312,600 | $30,000 | $95,040 |
| 2014 | $3,282 | $284,300 | $30,000 | $83,720 |
Source: Public Records
Map
Nearby Homes
- 302 Magnolia Trace
- 301 Dogwood Heights
- 304 Trecastle Ln
- 302 Trecastle Ln
- 221 Trecastle Square
- 217 Trecastle Square
- 664 Gold Valley Pass
- 834 Valley Dr Unit 1K
- 151 Birchwood Pass
- 265 Trecastle Square
- 829 Valley Dr
- 601 Redwood Ln
- 644 Gold Valley Pass
- 132 Staddlebridge Ave
- 711 Tall Oaks Dr
- 103 Overlook Ridge Way
- 0 Sixes Rd Unit 10648777
- 183 Overlook Ridge Way
- Jasper II Plan at Cambridge at Steels Bridge
- Newton II Plan at Cambridge at Steels Bridge
- 1112 Bridgemill Ave
- 1116 Bridge Mill Ave
- 1112 Bridge Mill Ave
- 306 Magnolia Trace
- 308 Magnolia Trace Unit 1I
- 1110 Bridge Mill Ave
- 1118 Bridge Mill Ave
- 304 Magnolia Trace
- 1113 Bridge Mill Ave
- 1115 Bridge Mill Ave
- 1111 Bridge Mill Ave
- 310 Magnolia Trace
- 1120 Bridge Mill Ave
- 1108 Bridge Mill Ave
- 1117 Bridge Mill Ave
- 600 Gold Valley Pass
- 1119 Bridgemill Ave
- 1119 Bridge Mill Ave
- 305 Magnolia Trace
- 1122 Bridge Mill Ave