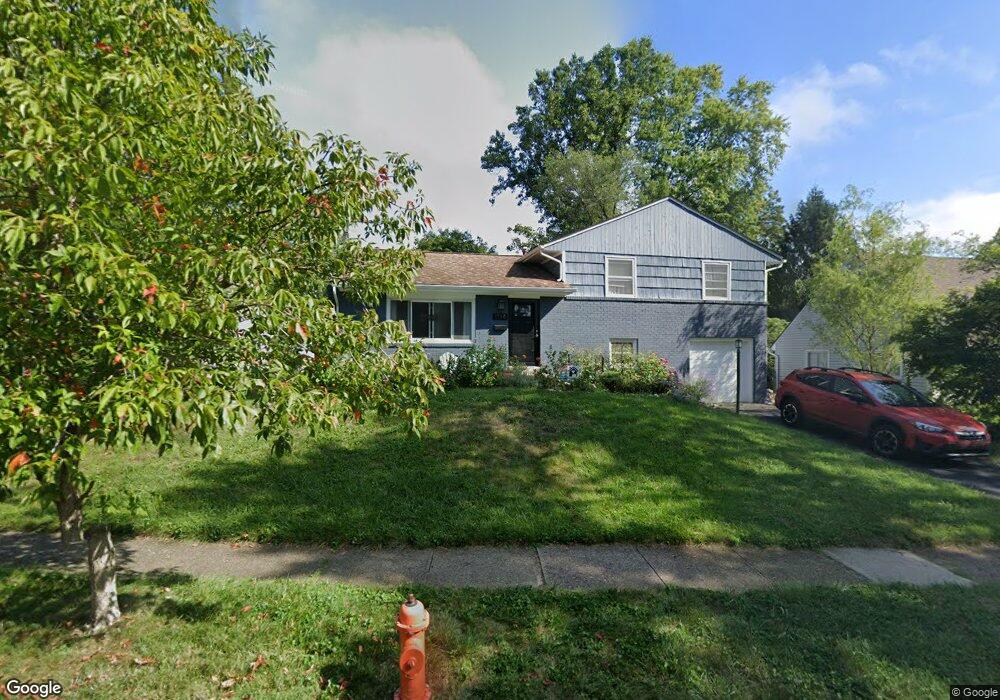
1114 Caniff Rd Columbus, OH 43221
Cranbrook NeighborhoodEstimated Value: $331,801 - $356,000
3
Beds
2
Baths
1,344
Sq Ft
$259/Sq Ft
Est. Value
About This Home
This home is located at 1114 Caniff Rd, Columbus, OH 43221 and is currently estimated at $347,450, approximately $258 per square foot. 1114 Caniff Rd is a home located in Franklin County with nearby schools including Cranbrook Elementary School, Ridgeview Middle School, and Centennial High School.
Ownership History
Date
Name
Owned For
Owner Type
Purchase Details
Closed on
Sep 24, 2019
Sold by
Nash Andrew P and Nash Amberr H
Bought by
Nash Andrew P and Nash Amber H
Current Estimated Value
Purchase Details
Closed on
Apr 29, 2010
Sold by
Nash Sarah J
Bought by
Nash Andrew P
Purchase Details
Closed on
May 28, 2009
Sold by
Lawhon William T and Lawhon Amanda L
Bought by
Nash Andrew P
Home Financials for this Owner
Home Financials are based on the most recent Mortgage that was taken out on this home.
Original Mortgage
$156,120
Outstanding Balance
$97,253
Interest Rate
4.83%
Mortgage Type
FHA
Estimated Equity
$250,197
Purchase Details
Closed on
May 18, 1994
Bought by
Hughes Stephanie R
Purchase Details
Closed on
Jun 1, 1992
Purchase Details
Closed on
Jan 1, 1986
Create a Home Valuation Report for This Property
The Home Valuation Report is an in-depth analysis detailing your home's value as well as a comparison with similar homes in the area
Home Values in the Area
Average Home Value in this Area
Purchase History
| Date | Buyer | Sale Price | Title Company |
|---|---|---|---|
| Nash Andrew P | -- | None Available | |
| Nash Andrew P | -- | Attorney | |
| Nash Andrew P | $159,000 | Title First | |
| Hughes Stephanie R | $94,500 | -- | |
| -- | $75,000 | -- | |
| -- | $67,500 | -- |
Source: Public Records
Mortgage History
| Date | Status | Borrower | Loan Amount |
|---|---|---|---|
| Open | Nash Andrew P | $156,120 |
Source: Public Records
Tax History
| Year | Tax Paid | Tax Assessment Tax Assessment Total Assessment is a certain percentage of the fair market value that is determined by local assessors to be the total taxable value of land and additions on the property. | Land | Improvement |
|---|---|---|---|---|
| 2025 | $3,960 | $88,240 | $38,610 | $49,630 |
| 2024 | $3,960 | $88,240 | $38,610 | $49,630 |
| 2023 | $3,910 | $88,235 | $38,605 | $49,630 |
| 2022 | $3,656 | $70,500 | $20,550 | $49,950 |
| 2021 | $3,663 | $70,500 | $20,550 | $49,950 |
| 2020 | $3,668 | $70,500 | $20,550 | $49,950 |
| 2019 | $3,323 | $54,780 | $20,550 | $34,230 |
| 2018 | $3,045 | $54,050 | $20,550 | $33,500 |
| 2017 | $3,277 | $54,050 | $20,550 | $33,500 |
| 2016 | $3,105 | $46,870 | $13,790 | $33,080 |
| 2015 | $2,818 | $46,870 | $13,790 | $33,080 |
| 2014 | $2,825 | $46,870 | $13,790 | $33,080 |
| 2013 | $1,327 | $44,625 | $13,125 | $31,500 |
Source: Public Records
Map
Nearby Homes
- 1121 Afton Rd
- 3190 Kenny Rd
- 1530 Pemberton Dr
- 1485 Trentwood Rd
- 723 Drummond Ct
- 1224 Kenbrook Hills Dr Unit 25
- 667 Riverview Dr
- 3418 Sunningdale Way
- 2803 N Star Rd
- 1763-1769 Ardleigh Rd Unit 1763-1769
- 1744 Ridgecliff Rd Unit 12
- 1165 Highland Dr
- 1842 Ridgecliff Rd
- 263 W North Broadway St
- 1872 Kentwell Rd Unit 1872
- 3106 Somerford Rd
- 231 W Pacemont Rd Unit 235
- 222 W North Broadway St
- 123 W Como Ave
- 2585 Westmont Blvd
- 1104 Caniff Rd
- 3340 Clearview Ave
- 1111 Bernard Rd
- 1101 Bernard Rd
- 1094 Caniff Rd
- 3348 Clearview Ave
- 1093 Bernard Rd
- 1109 Caniff Rd
- 1119 Caniff Rd
- 1101 Caniff Rd
- 1086 Caniff Rd
- 3335 Clearview Ave
- 1083 Bernard Rd
- 1093 Caniff Rd
- 3339 Clearview Ave
- 1080 Caniff Rd
- 1145 Bernard Rd
- 1085 Caniff Rd
- 3368 Clearview Ave
- 1075 Bernard Rd
Your Personal Tour Guide
Ask me questions while you tour the home.