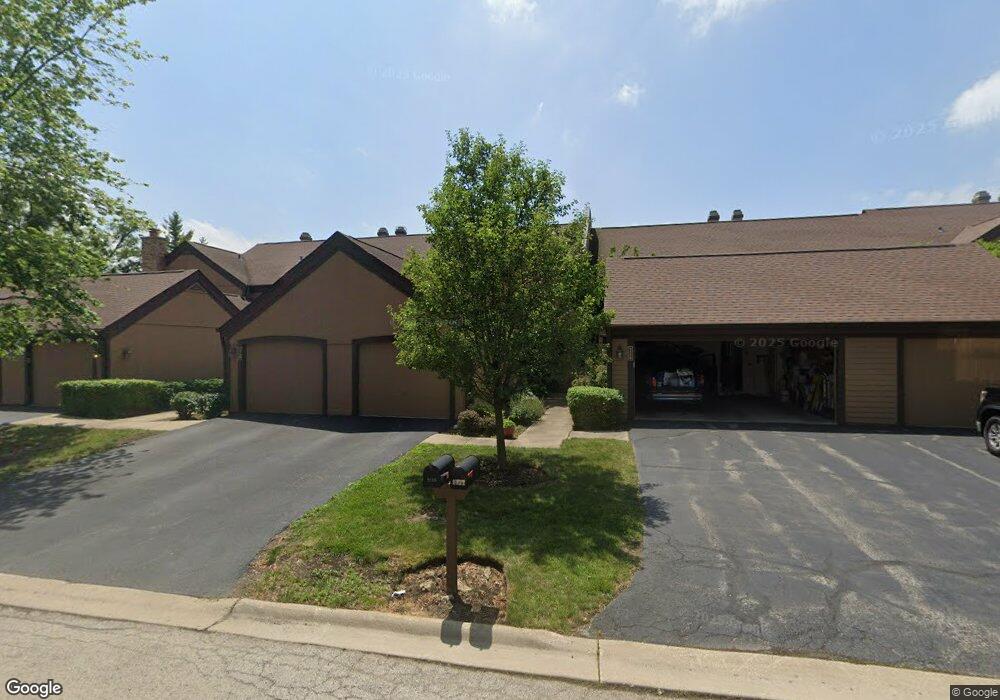
1114 Franklin Ln Unit 114 Buffalo Grove, IL 60089
Estimated Value: $394,000 - $423,000
3
Beds
3
Baths
1,524
Sq Ft
$267/Sq Ft
Est. Value
About This Home
This home is located at 1114 Franklin Ln Unit 114, Buffalo Grove, IL 60089 and is currently estimated at $407,311, approximately $267 per square foot. 1114 Franklin Ln Unit 114 is a home located in Lake County with nearby schools including Kildeer Countryside Elementary School, Woodlawn Middle School, and Adlai E Stevenson High School.
Ownership History
Date
Name
Owned For
Owner Type
Purchase Details
Closed on
Feb 24, 2021
Sold by
Beryozkin Lyudmila
Bought by
Briscoe Valerie
Current Estimated Value
Home Financials for this Owner
Home Financials are based on the most recent Mortgage that was taken out on this home.
Original Mortgage
$236,000
Outstanding Balance
$211,736
Interest Rate
2.75%
Mortgage Type
New Conventional
Estimated Equity
$195,575
Purchase Details
Closed on
Sep 21, 2017
Sold by
Heine Patricia M
Bought by
Beryozkin Lyudmila
Home Financials for this Owner
Home Financials are based on the most recent Mortgage that was taken out on this home.
Original Mortgage
$256,155
Interest Rate
4%
Mortgage Type
FHA
Purchase Details
Closed on
May 14, 2014
Sold by
Fitzgerald John A and Fitzgerald Ann C
Bought by
Heine Patricia M and The Patricia M Heine Declaration Of Trus
Create a Home Valuation Report for This Property
The Home Valuation Report is an in-depth analysis detailing your home's value as well as a comparison with similar homes in the area
Home Values in the Area
Average Home Value in this Area
Purchase History
| Date | Buyer | Sale Price | Title Company |
|---|---|---|---|
| Briscoe Valerie | $295,000 | Attorney | |
| Beryozkin Lyudmila | $265,000 | First American Title | |
| Heine Patricia M | $259,000 | Fidelity National Title |
Source: Public Records
Mortgage History
| Date | Status | Borrower | Loan Amount |
|---|---|---|---|
| Open | Briscoe Valerie | $236,000 | |
| Previous Owner | Beryozkin Lyudmila | $256,155 |
Source: Public Records
Tax History Compared to Growth
Tax History
| Year | Tax Paid | Tax Assessment Tax Assessment Total Assessment is a certain percentage of the fair market value that is determined by local assessors to be the total taxable value of land and additions on the property. | Land | Improvement |
|---|---|---|---|---|
| 2024 | $9,084 | $102,331 | $27,439 | $74,892 |
| 2023 | $7,946 | $96,557 | $25,891 | $70,666 |
| 2022 | $7,946 | $82,206 | $22,043 | $60,163 |
| 2021 | $7,642 | $81,319 | $24,604 | $56,715 |
| 2020 | $7,463 | $81,596 | $24,688 | $56,908 |
| 2019 | $7,363 | $81,295 | $24,597 | $56,698 |
| 2018 | $6,609 | $78,311 | $23,694 | $54,617 |
| 2017 | $6,238 | $76,483 | $23,141 | $53,342 |
| 2016 | $6,043 | $73,238 | $22,159 | $51,079 |
| 2015 | $5,832 | $68,492 | $20,723 | $47,769 |
| 2014 | $6,175 | $65,989 | $22,256 | $43,733 |
| 2012 | $6,126 | $66,122 | $22,301 | $43,821 |
Source: Public Records
Map
Nearby Homes
- 1117 Franklin Ln Unit C52
- 1325 Fairfax Ln
- 12 Cloverdale Ct
- 5107 N Arlington Heights Rd
- 1514 Sumter Dr
- 4106 Bob o Link Ln
- 1327 Larchmont Dr
- 1545 Chickamauga Ln
- 620 Twisted Oak Ln
- 760 Checker Dr
- 1144 Steeple View Dr
- 5135 Bridlewood Ct
- 1146 Steeple View Dr
- 810 Silver Rock Ln
- 1728 Holly Ct
- 1315 Gail Dr
- 531 Lasalle Ln
- 630 Woodhollow Ln
- 1112 Auburn Ln
- 1763 Country Club Dr
- 1114 Franklin Ln
- 1114 Franklin Ln Unit 1114
- 1118 Franklin Ln Unit G52
- 1110 Franklin Ln Unit G32
- 1122 Franklin Ln Unit G62
- 1122 Franklin Ln Unit 1122
- 1106 Franklin Ln Unit G22
- 1126 Franklin Ln Unit G72
- 1102 Franklin Ln
- 1130 Franklin Ln Unit G82
- 1410 Fairfax Ln Unit H12
- 1414 Fairfax Ln Unit H22
- 1418 Fairfax Ln Unit 1132
- 1422 Fairfax Ln Unit 1142
- 1136 Franklin Ln Unit F12
- 1121 Franklin Ln Unit C62
- 1113 Franklin Ln Unit C42
- 1109 Franklin Ln Unit C32
- 1125 Franklin Ln
- 1426 Fairfax Ln Unit H52