Estimated Value: $173,000 - $193,000
3
Beds
1
Bath
999
Sq Ft
$181/Sq Ft
Est. Value
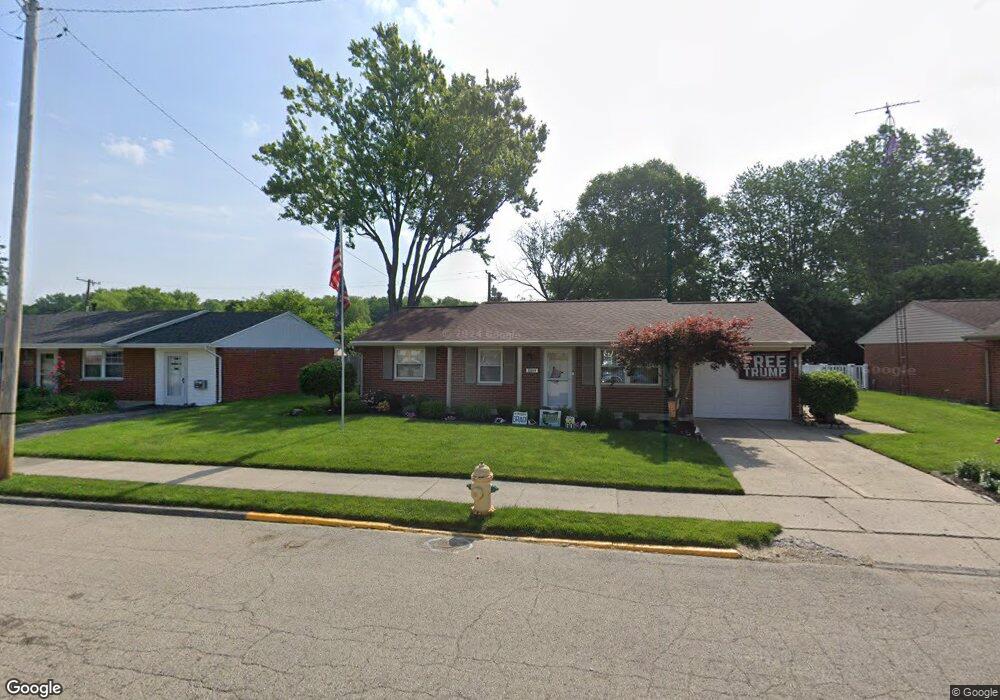
About This Home
This home is located at 1114 Mystic Ln S, Troy, OH 45373 and is currently estimated at $180,976, approximately $181 per square foot. 1114 Mystic Ln S is a home located in Miami County with nearby schools including Cookson Elementary School, Troy Junior High School, and Van Cleve Elementary School.
Ownership History
Date
Name
Owned For
Owner Type
Purchase Details
Closed on
Dec 2, 2011
Sold by
Bertke Misty R
Bought by
Bertke John F
Current Estimated Value
Purchase Details
Closed on
Dec 1, 2011
Sold by
Bertke Misty R
Bought by
Bertke John F
Purchase Details
Closed on
Oct 1, 2003
Sold by
Rademachir Todd A and Partlow Alicia A
Bought by
Bertke John F and Barnhart Misty R
Home Financials for this Owner
Home Financials are based on the most recent Mortgage that was taken out on this home.
Original Mortgage
$95,993
Interest Rate
6.4%
Mortgage Type
FHA
Purchase Details
Closed on
Jul 11, 2001
Sold by
Perkins James A
Bought by
Rademachir Todd A and Partlow Alicia A
Home Financials for this Owner
Home Financials are based on the most recent Mortgage that was taken out on this home.
Original Mortgage
$88,511
Interest Rate
7.27%
Mortgage Type
FHA
Purchase Details
Closed on
May 4, 1993
Bought by
Perkins James A
Create a Home Valuation Report for This Property
The Home Valuation Report is an in-depth analysis detailing your home's value as well as a comparison with similar homes in the area
Home Values in the Area
Average Home Value in this Area
Purchase History
| Date | Buyer | Sale Price | Title Company |
|---|---|---|---|
| Bertke John F | -- | -- | |
| Bertke John F | -- | -- | |
| Bertke John F | $97,500 | -- | |
| Rademachir Todd A | $89,900 | -- | |
| Perkins James A | $47,000 | -- |
Source: Public Records
Mortgage History
| Date | Status | Borrower | Loan Amount |
|---|---|---|---|
| Previous Owner | Rademachir Todd A | $95,993 | |
| Previous Owner | Rademachir Todd A | $88,511 |
Source: Public Records
Tax History Compared to Growth
Tax History
| Year | Tax Paid | Tax Assessment Tax Assessment Total Assessment is a certain percentage of the fair market value that is determined by local assessors to be the total taxable value of land and additions on the property. | Land | Improvement |
|---|---|---|---|---|
| 2024 | $1,598 | $42,390 | $11,550 | $30,840 |
| 2023 | $1,598 | $42,390 | $11,550 | $30,840 |
| 2022 | $1,331 | $42,390 | $11,550 | $30,840 |
| 2021 | $1,078 | $32,620 | $8,890 | $23,730 |
| 2020 | $1,080 | $32,620 | $8,890 | $23,730 |
| 2019 | $1,090 | $32,620 | $8,890 | $23,730 |
| 2018 | $1,005 | $28,950 | $9,420 | $19,530 |
| 2017 | $1,015 | $28,950 | $9,420 | $19,530 |
| 2016 | $1,000 | $28,950 | $9,420 | $19,530 |
| 2015 | $984 | $27,300 | $8,890 | $18,410 |
| 2014 | $984 | $27,300 | $8,890 | $18,410 |
| 2013 | $990 | $27,300 | $8,890 | $18,410 |
Source: Public Records
Map
Nearby Homes
- 1002 Stonyridge Ave
- 429 Forrest Ln
- 1075 Crestview Dr
- 1329 Lee Rd
- 1947 Woodcliffe Dr
- 605 Ohio Ave
- 1760 Hunters Ridge Dr
- 1500 Paradise Trail
- 731 Michigan Ave
- 1400 Troy Urbana Rd
- 708 N Market St
- 190 Robin Hood Ln
- 1160 Waterloo St
- 1188 E Bentley Cir
- 1164 Waterloo St
- 1137 Auburn St
- 755 W Bentley Cir
- 1102 E Franklin St
- 221 Finsbury Ln
- 838 W Bentley Cir
- 1115 Mystic Ln N
- 1106 Mystic Ln S
- 688 Stonyridge Ave
- 692 Stonyridge Ave
- 684 Stonyridge Ave
- 1107 Mystic Ln N
- 1089 Mystic Ln S
- 1098 Mystic Ln S
- 1081 Mystic Ln S
- 696 Stonyridge Ave
- 680 Stonyridge Ave
- 1084 Mystic Ln N
- 1090 Mystic Ln S
- 1084 N Mystic Ln
- 732 Stonyridge Ave
- 1099 Mystic Ln N
- 1073 Mystic Ln S
- 676 Stonyridge Ave
- 1082 Mystic Ln S
- 1076 Mystic Ln N