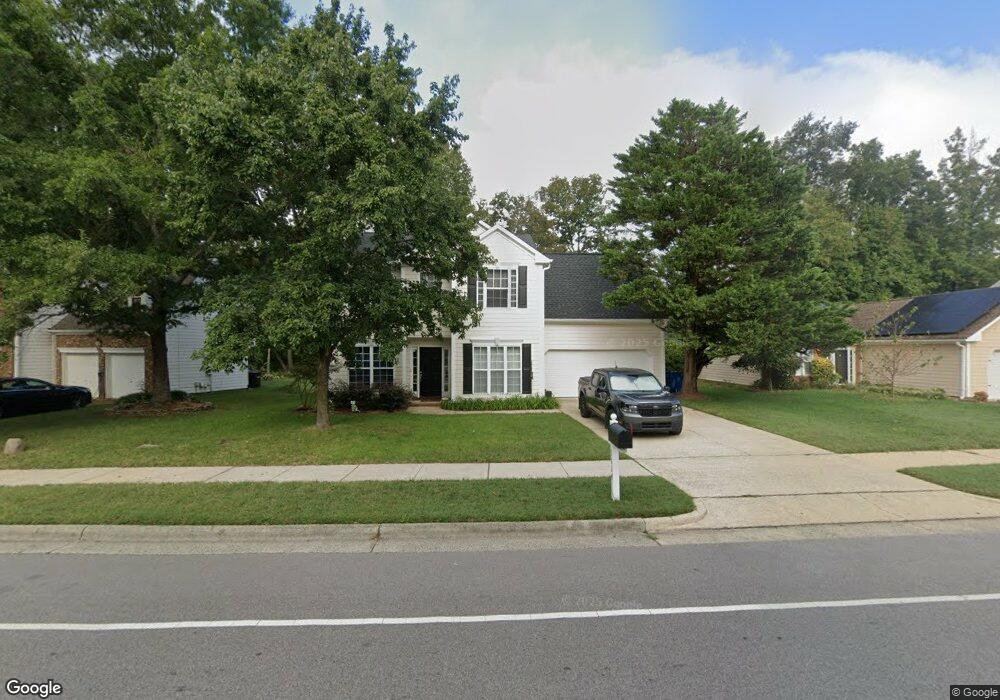
1114 Nichols Farm Dr Durham, NC 27703
Eastern Durham NeighborhoodEstimated Value: $367,910 - $406,000
4
Beds
3
Baths
1,730
Sq Ft
$226/Sq Ft
Est. Value
About This Home
This home is located at 1114 Nichols Farm Dr, Durham, NC 27703 and is currently estimated at $391,728, approximately $226 per square foot. 1114 Nichols Farm Dr is a home located in Durham County with nearby schools including Oak Grove Elementary, John W Neal Middle School, and Southern School of Energy & Sustainability.
Ownership History
Date
Name
Owned For
Owner Type
Purchase Details
Closed on
Sep 25, 2015
Sold by
Brown Collin Jeffrey and Brown Mirta Sarahi Aguilera
Bought by
Bonnemere Demar Edward and Bonnemere Bethany Innes
Current Estimated Value
Home Financials for this Owner
Home Financials are based on the most recent Mortgage that was taken out on this home.
Original Mortgage
$174,800
Outstanding Balance
$137,531
Interest Rate
3.88%
Mortgage Type
New Conventional
Estimated Equity
$254,197
Purchase Details
Closed on
Mar 2, 2012
Sold by
Secretary Of Housing And Urban Developme
Bought by
Brown Collin Jeffrey
Home Financials for this Owner
Home Financials are based on the most recent Mortgage that was taken out on this home.
Original Mortgage
$131,199
Interest Rate
3.97%
Mortgage Type
FHA
Purchase Details
Closed on
Nov 30, 2011
Sold by
Grant Garland and Grant Ugeana
Bought by
Secretary Of Housing & Urban Development
Purchase Details
Closed on
Sep 26, 2000
Sold by
Juvvadi Rajeswar R and Juvvadi Sudha R
Bought by
Grant Garland D and Grant Ugeana
Home Financials for this Owner
Home Financials are based on the most recent Mortgage that was taken out on this home.
Original Mortgage
$149,796
Interest Rate
7.92%
Mortgage Type
FHA
Create a Home Valuation Report for This Property
The Home Valuation Report is an in-depth analysis detailing your home's value as well as a comparison with similar homes in the area
Home Values in the Area
Average Home Value in this Area
Purchase History
| Date | Buyer | Sale Price | Title Company |
|---|---|---|---|
| Bonnemere Demar Edward | $184,000 | Attorney | |
| Brown Collin Jeffrey | -- | None Available | |
| Secretary Of Housing & Urban Development | $149,875 | None Available | |
| Grant Garland D | $150,000 | -- |
Source: Public Records
Mortgage History
| Date | Status | Borrower | Loan Amount |
|---|---|---|---|
| Open | Bonnemere Demar Edward | $174,800 | |
| Previous Owner | Brown Collin Jeffrey | $131,199 | |
| Previous Owner | Grant Garland D | $149,796 |
Source: Public Records
Tax History
| Year | Tax Paid | Tax Assessment Tax Assessment Total Assessment is a certain percentage of the fair market value that is determined by local assessors to be the total taxable value of land and additions on the property. | Land | Improvement |
|---|---|---|---|---|
| 2025 | $3,510 | $354,122 | $64,811 | $289,311 |
| 2024 | $2,869 | $205,649 | $47,100 | $158,549 |
| 2023 | $2,694 | $205,649 | $47,100 | $158,549 |
| 2022 | $2,632 | $205,649 | $47,100 | $158,549 |
| 2021 | $2,620 | $205,649 | $47,100 | $158,549 |
| 2020 | $2,558 | $205,649 | $47,100 | $158,549 |
| 2019 | $2,558 | $205,649 | $47,100 | $158,549 |
| 2018 | $2,208 | $162,738 | $34,540 | $128,198 |
| 2017 | $2,191 | $162,738 | $34,540 | $128,198 |
| 2016 | $2,117 | $162,738 | $34,540 | $128,198 |
| 2015 | $2,271 | $164,066 | $37,781 | $126,285 |
| 2014 | $2,271 | $164,066 | $37,781 | $126,285 |
Source: Public Records
Map
Nearby Homes
- 615 Southshore Pkwy
- 604 Bellmeade Bay Dr
- 3908 Holder Rd
- 501 Bellmeade Bay Dr
- 411 Bellmeade Bay Dr
- 907 Danbury Dr
- 1315 Pennock Rd
- 601 Crossing Dr
- 1107 High Fox Dr
- 4 Jarvis Ct
- 610 Sherron Rd
- 517 Keith St
- 208 Lick Creek Ln
- 442 Gus Rd
- 1015 Sora Way
- 210 Stoney Creek Cir
- 1204 Constellation Cir
- 1202 Constellation Cir
- 807 Outlaw Ave
- 110 Kindlewood Dr
- 1112 Nichols Farm Dr
- 1116 Nichols Farm Dr
- 4211 Holder Rd
- 1110 Nichols Farm Dr
- 1113 Nichols Farm Dr
- 1111 Nichols Farm Dr
- 1108 Nichols Farm Dr
- 1109 Nichols Farm Dr
- 1107 Nichols Farm Dr
- 1115 Nichols Farm Dr
- 1106 Nichols Farm Dr
- 1117 Nichols Farm Dr
- 105 Leacroft Way
- 1105 Nichols Farm Dr
- 109 Leacroft Way
- 4308 Holder Rd
- 4205 Holder Rd
- 113 Leacroft Way
- 117 Leacroft Way
- 4310 Holder Rd
Your Personal Tour Guide
Ask me questions while you tour the home.