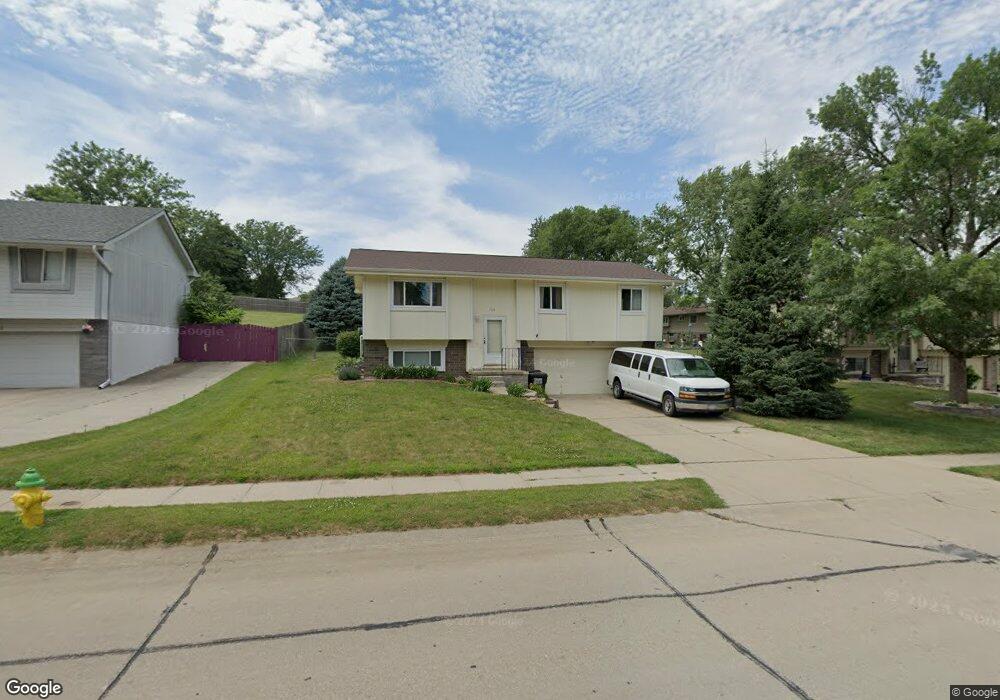
1114 Overland Trail Papillion, NE 68046
Estimated Value: $277,000 - $291,000
3
Beds
4
Baths
1,500
Sq Ft
$190/Sq Ft
Est. Value
About This Home
This home is located at 1114 Overland Trail, Papillion, NE 68046 and is currently estimated at $285,062, approximately $190 per square foot. 1114 Overland Trail is a home located in Sarpy County with nearby schools including Trumble Park Elementary School, Papillion Middle School, and Papillion La Vista South High School.
Ownership History
Date
Name
Owned For
Owner Type
Purchase Details
Closed on
Oct 1, 2015
Sold by
Locke Joseph C
Bought by
Michela Jonathan W and Michela Racheal L
Current Estimated Value
Home Financials for this Owner
Home Financials are based on the most recent Mortgage that was taken out on this home.
Original Mortgage
$124,511
Outstanding Balance
$97,864
Interest Rate
3.85%
Estimated Equity
$187,198
Purchase Details
Closed on
Mar 29, 2011
Sold by
The Bank Of New York Mellon Trust Compan
Bought by
Locke Joseph C
Home Financials for this Owner
Home Financials are based on the most recent Mortgage that was taken out on this home.
Original Mortgage
$106,236
Interest Rate
5.25%
Mortgage Type
FHA
Purchase Details
Closed on
Aug 31, 2010
Sold by
Thiessen Ramona
Bought by
The Bank Of New York Mellon Trust Compan and The Bank Of New York Trust Company N A
Create a Home Valuation Report for This Property
The Home Valuation Report is an in-depth analysis detailing your home's value as well as a comparison with similar homes in the area
Home Values in the Area
Average Home Value in this Area
Purchase History
| Date | Buyer | Sale Price | Title Company |
|---|---|---|---|
| Michela Jonathan W | $140,000 | Clear Title & Abstract Llc | |
| Locke Joseph C | $109,000 | Rels Title Omaha | |
| The Bank Of New York Mellon Trust Compan | $101,250 | None Available |
Source: Public Records
Mortgage History
| Date | Status | Borrower | Loan Amount |
|---|---|---|---|
| Open | Michela Jonathan W | $124,511 | |
| Previous Owner | Locke Joseph C | $106,236 |
Source: Public Records
Tax History Compared to Growth
Tax History
| Year | Tax Paid | Tax Assessment Tax Assessment Total Assessment is a certain percentage of the fair market value that is determined by local assessors to be the total taxable value of land and additions on the property. | Land | Improvement |
|---|---|---|---|---|
| 2025 | $3,394 | $247,464 | $44,000 | $203,464 |
| 2024 | $4,054 | $228,613 | $40,000 | $188,613 |
| 2023 | $4,054 | $215,279 | $35,000 | $180,279 |
| 2022 | $3,905 | $191,334 | $33,000 | $158,334 |
| 2021 | $3,623 | $174,032 | $29,000 | $145,032 |
| 2020 | $3,315 | $157,663 | $29,000 | $128,663 |
| 2019 | $3,261 | $155,163 | $27,000 | $128,163 |
| 2018 | $3,161 | $148,137 | $24,000 | $124,137 |
| 2017 | $3,019 | $141,537 | $22,000 | $119,537 |
| 2016 | $2,851 | $133,874 | $22,000 | $111,874 |
| 2015 | $2,684 | $126,357 | $22,000 | $104,357 |
| 2014 | $2,569 | $120,135 | $22,000 | $98,135 |
| 2012 | -- | $118,270 | $22,000 | $96,270 |
Source: Public Records
Map
Nearby Homes
- Lot 130 Shadow Lake 2
- TBD Slayton St
- 907 Woodland Ave
- 906 Chisholm Trail
- 809 Buckboard Blvd
- 1210 Devon Dr
- Lot 28 Ashbury Hills
- 12378 Lake Vista Dr
- 262 Ashbury Hills St
- 259 Ashbury Hils St
- 235 Lot St
- 801 S Fillmore St
- Lot 71 N Shore Commercial
- Lot 39
- 11011 S 98th St
- 11007 S 98th St
- 9801 Overland Trail
- 9803 Cumberland Dr
- 613 Valley Rd
- 9808 Overland Trail
- 1114 Overland Trail
- 1116 Overland Trail
- 1112 Overland Trail
- 1116 Overland Trail
- 1110 Overland Trail
- 1115 Overland Trail
- 1115 Crest Cir
- 1117 Overland Trail
- 1113 Overland Trail
- 1118 Overland Trail
- 1119 Overland Trail
- 1111 Overland Trail
- 1113 Crest Cir
- 1120 Crest Cir
- 1001 Conestoga Rd
- 1106 Horseshoe Cir
- 1104 Horseshoe Cir
- 1109 Crest Rd
- 713 Laredo Cir
- 1105 Crest Rd