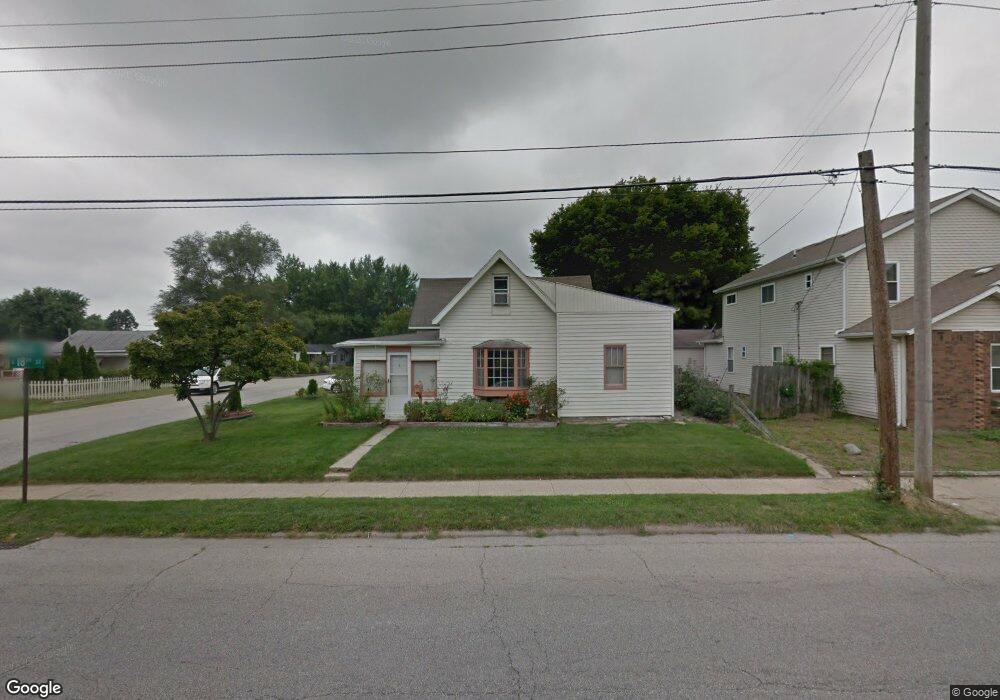
1114 S 18th St Lafayette, IN 47905
Central NeighborhoodEstimated Value: $224,000 - $282,000
3
Beds
3
Baths
2,605
Sq Ft
$96/Sq Ft
Est. Value
About This Home
This home is located at 1114 S 18th St, Lafayette, IN 47905 and is currently estimated at $249,401, approximately $95 per square foot. 1114 S 18th St is a home located in Tippecanoe County with nearby schools including Oakland Elementary School, Lafayette Tecumseh Junior High School, and Sunnyside Intermediate School.
Ownership History
Date
Name
Owned For
Owner Type
Purchase Details
Closed on
Jun 8, 2016
Sold by
Delgado Rafeal
Bought by
Delgado Josselin H
Current Estimated Value
Purchase Details
Closed on
Oct 22, 2015
Sold by
Perez Emilia
Bought by
Delgado Rafael
Purchase Details
Closed on
Sep 14, 2001
Sold by
Summers Matthew W
Bought by
Perez Emilia and Delgado Rafael
Home Financials for this Owner
Home Financials are based on the most recent Mortgage that was taken out on this home.
Original Mortgage
$87,121
Interest Rate
7.06%
Mortgage Type
FHA
Create a Home Valuation Report for This Property
The Home Valuation Report is an in-depth analysis detailing your home's value as well as a comparison with similar homes in the area
Home Values in the Area
Average Home Value in this Area
Purchase History
| Date | Buyer | Sale Price | Title Company |
|---|---|---|---|
| Delgado Josselin H | -- | -- | |
| Delgado Rafael | -- | -- | |
| Perez Emilia | -- | Poelstra Title Company | |
| Summers Matthew W | -- | Poelstra Title Company |
Source: Public Records
Mortgage History
| Date | Status | Borrower | Loan Amount |
|---|---|---|---|
| Previous Owner | Perez Emilia | $87,121 |
Source: Public Records
Tax History Compared to Growth
Tax History
| Year | Tax Paid | Tax Assessment Tax Assessment Total Assessment is a certain percentage of the fair market value that is determined by local assessors to be the total taxable value of land and additions on the property. | Land | Improvement |
|---|---|---|---|---|
| 2024 | $1,430 | $159,000 | $24,000 | $135,000 |
| 2023 | $1,363 | $154,200 | $24,000 | $130,200 |
| 2022 | $1,340 | $138,200 | $24,000 | $114,200 |
| 2021 | $1,106 | $120,500 | $24,000 | $96,500 |
| 2020 | $895 | $108,600 | $24,000 | $84,600 |
| 2019 | $808 | $103,400 | $18,800 | $84,600 |
| 2018 | $754 | $99,600 | $18,800 | $80,800 |
| 2017 | $706 | $97,100 | $18,800 | $78,300 |
| 2016 | $662 | $95,200 | $18,800 | $76,400 |
| 2014 | $581 | $90,400 | $18,800 | $71,600 |
| 2013 | $550 | $87,500 | $18,800 | $68,700 |
Source: Public Records
Map
Nearby Homes
- 1501 Franklin St
- 1639 Stanforth Ave
- 1226 Sinton Ave
- 1111 S 14th St
- 815 S 19th St
- 1318 Sinton Ave
- 2109 Central St
- 1501 El Prado Ave
- 807 S 20th St
- 1214 King St
- 1204 Central St
- 1511 Kossuth St
- 1422 Virginia St
- 1406 Virginia St
- 1309 S 23rd St
- 626 S 21st St
- 622 S 21st St
- 1108 Potomac Ave
- 900 King St
- 1622 Perdue St