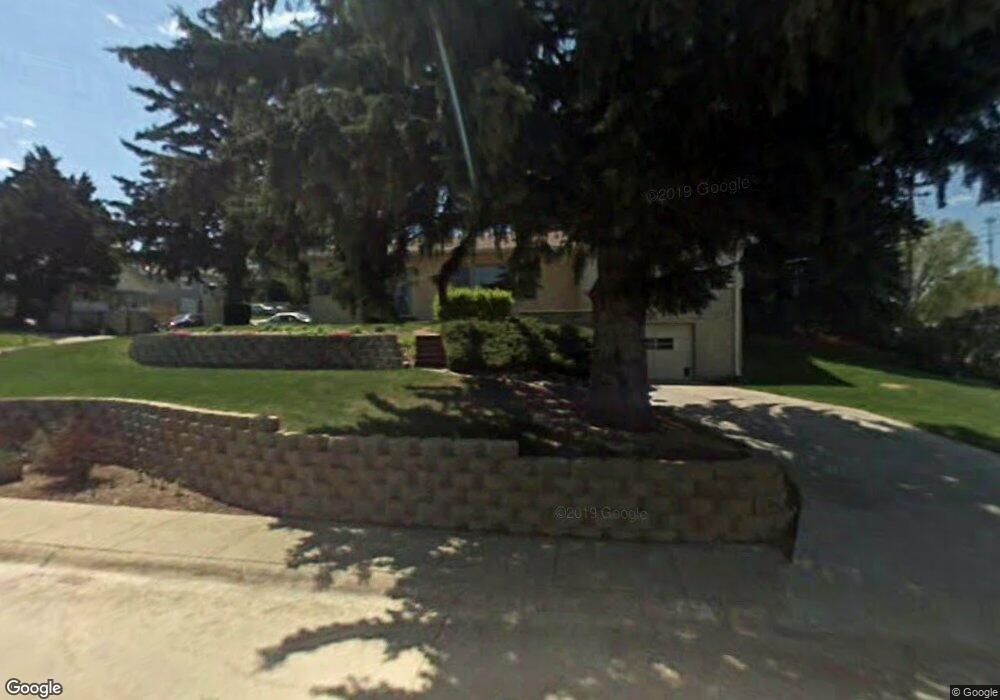
1114 S H St Broken Bow, NE 68822
Estimated Value: $174,000 - $200,416
--
Bed
--
Bath
1,408
Sq Ft
$131/Sq Ft
Est. Value
About This Home
This home is located at 1114 S H St, Broken Bow, NE 68822 and is currently estimated at $184,104, approximately $130 per square foot. 1114 S H St is a home located in Custer County with nearby schools including North Park Elementary School, Broken Bow Junior High School, and Broken Bow High School.
Ownership History
Date
Name
Owned For
Owner Type
Purchase Details
Closed on
Aug 7, 2024
Sold by
Huffman Michael R
Bought by
Richardson Charlotte and Erstrom Dakota
Current Estimated Value
Home Financials for this Owner
Home Financials are based on the most recent Mortgage that was taken out on this home.
Original Mortgage
$169,000
Outstanding Balance
$166,776
Interest Rate
6.86%
Mortgage Type
Construction
Estimated Equity
$17,328
Purchase Details
Closed on
Jun 1, 2010
Sold by
Huffman Gary L and Huffman Joyce E
Bought by
Huffman Michael R
Purchase Details
Closed on
Nov 21, 2007
Sold by
Russell Thaddeus J
Bought by
Huffman Gary L and Huffman Joyce E
Purchase Details
Closed on
Jan 7, 2005
Sold by
Goben Clinton E and Goben Mary G
Bought by
Russell Thaddeus J and Russell Jessica S
Create a Home Valuation Report for This Property
The Home Valuation Report is an in-depth analysis detailing your home's value as well as a comparison with similar homes in the area
Home Values in the Area
Average Home Value in this Area
Purchase History
| Date | Buyer | Sale Price | Title Company |
|---|---|---|---|
| Richardson Charlotte | $170,000 | Custer Title & Abs | |
| Huffman Michael R | $91,000 | -- | |
| Huffman Gary L | $91,000 | -- | |
| Russell Thaddeus J | $84,000 | -- |
Source: Public Records
Mortgage History
| Date | Status | Borrower | Loan Amount |
|---|---|---|---|
| Open | Richardson Charlotte | $169,000 |
Source: Public Records
Tax History Compared to Growth
Tax History
| Year | Tax Paid | Tax Assessment Tax Assessment Total Assessment is a certain percentage of the fair market value that is determined by local assessors to be the total taxable value of land and additions on the property. | Land | Improvement |
|---|---|---|---|---|
| 2025 | $2,080 | $188,701 | $10,752 | $177,949 |
| 2024 | $2,080 | $151,725 | $10,752 | $140,973 |
| 2023 | $2,136 | $136,378 | $10,752 | $125,626 |
| 2022 | $2,248 | $122,495 | $10,752 | $111,743 |
| 2021 | $2,185 | $121,823 | $10,080 | $111,743 |
| 2020 | $2,167 | $121,823 | $10,080 | $111,743 |
| 2019 | $1,850 | $104,179 | $8,400 | $95,779 |
| 2017 | $1,804 | $98,796 | $8,400 | $90,396 |
| 2016 | $1,909 | $95,548 | $5,152 | $90,396 |
| 2015 | $1,825 | $90,553 | $5,051 | $85,502 |
| 2014 | $1,825 | $82,321 | $4,592 | $77,729 |
Source: Public Records
Map
Nearby Homes