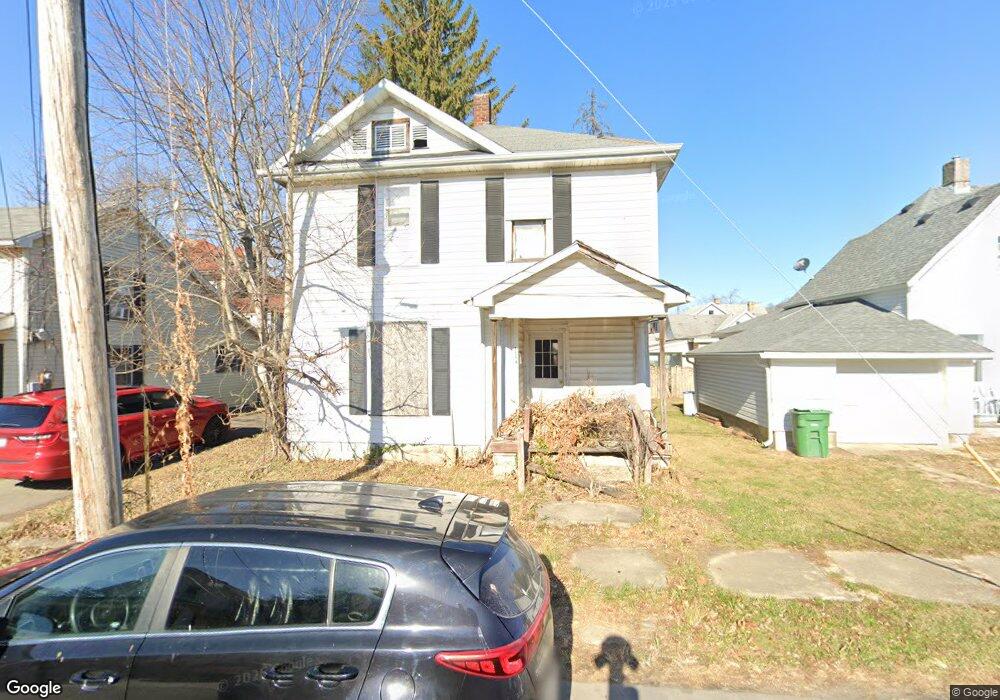
1114 Spring St New Castle, IN 47362
Estimated Value: $101,000 - $141,000
4
Beds
2
Baths
1,360
Sq Ft
$92/Sq Ft
Est. Value
About This Home
This home is located at 1114 Spring St, New Castle, IN 47362 and is currently estimated at $124,894, approximately $91 per square foot. 1114 Spring St is a home located in Henry County with nearby schools including Agape Learning Center.
Ownership History
Date
Name
Owned For
Owner Type
Purchase Details
Closed on
Feb 25, 2014
Sold by
Jaime Manzanera
Bought by
Comian Xiii Tax Lien Fund Llc
Current Estimated Value
Purchase Details
Closed on
Sep 28, 2011
Sold by
Lewis Kevin R and Smith Rachel A
Bought by
Manzanera Jaime
Purchase Details
Closed on
Jun 7, 2006
Sold by
Adams Jacob L
Bought by
Lewis Kevin R and Smith Rachel A
Home Financials for this Owner
Home Financials are based on the most recent Mortgage that was taken out on this home.
Original Mortgage
$50,000
Interest Rate
6.66%
Mortgage Type
New Conventional
Create a Home Valuation Report for This Property
The Home Valuation Report is an in-depth analysis detailing your home's value as well as a comparison with similar homes in the area
Home Values in the Area
Average Home Value in this Area
Purchase History
| Date | Buyer | Sale Price | Title Company |
|---|---|---|---|
| Comian Xiii Tax Lien Fund Llc | $683 | None Available | |
| Manzanera Jaime | $901 | None Available | |
| Lewis Kevin R | -- | None Available |
Source: Public Records
Mortgage History
| Date | Status | Borrower | Loan Amount |
|---|---|---|---|
| Previous Owner | Lewis Kevin R | $50,000 |
Source: Public Records
Tax History Compared to Growth
Tax History
| Year | Tax Paid | Tax Assessment Tax Assessment Total Assessment is a certain percentage of the fair market value that is determined by local assessors to be the total taxable value of land and additions on the property. | Land | Improvement |
|---|---|---|---|---|
| 2024 | $1,220 | $61,000 | $10,500 | $50,500 |
| 2023 | $1,168 | $58,400 | $10,500 | $47,900 |
| 2022 | $979 | $48,700 | $5,200 | $43,500 |
| 2021 | $819 | $40,700 | $4,600 | $36,100 |
| 2020 | $2,962 | $39,100 | $4,600 | $34,500 |
| 2019 | $2,041 | $38,400 | $4,600 | $33,800 |
| 2018 | $1,201 | $37,000 | $4,100 | $32,900 |
| 2017 | $1,695 | $37,300 | $4,100 | $33,200 |
| 2016 | $1,271 | $36,400 | $4,100 | $32,300 |
| 2014 | $1,048 | $52,400 | $4,700 | $47,700 |
| 2013 | $1,048 | $49,100 | $4,700 | $44,400 |
Source: Public Records
Map
Nearby Homes
- 000 S St Rd 103
- 922 Spring St
- 321 N Main St
- 1010 Church St
- 909 Church St
- 1324 Thornburg St
- 709 Broad St
- 504 N 12th St
- 203 S 7th St
- 000 Wittenbraker Ave
- 400 S 14th St
- 313 S 7th St
- 1506 Kentucky Ave
- 711 N 14th St
- 512 N 16th St
- 1608 Indiana Ave
- 630 S 11th St
- 1510 Michigan St
- 1707 Woodward Ave
- 701 Hawthorn Rd