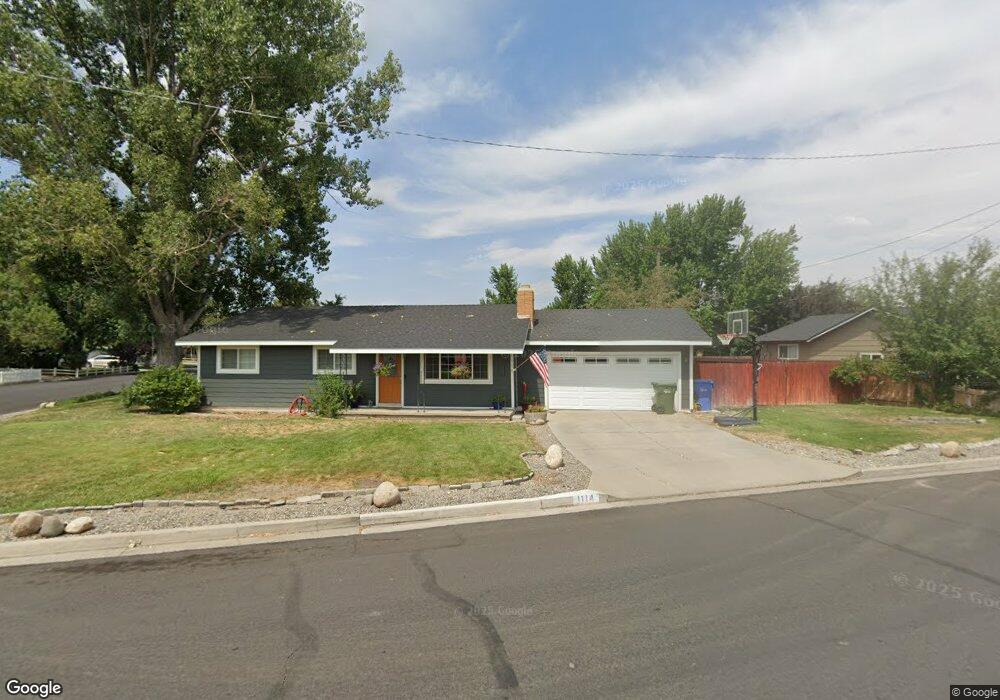
1114 Spruce St Gardnerville, NV 89410
Estimated Value: $518,000 - $561,251
3
Beds
2
Baths
1,410
Sq Ft
$388/Sq Ft
Est. Value
About This Home
This home is located at 1114 Spruce St, Gardnerville, NV 89410 and is currently estimated at $546,563, approximately $387 per square foot. 1114 Spruce St is a home located in Douglas County with nearby schools including Minden Elementary School, Carson Valley Middle School, and Douglas County High School.
Ownership History
Date
Name
Owned For
Owner Type
Purchase Details
Closed on
Jul 8, 2009
Sold by
Hamer John F and Hamer Linda M
Bought by
Hamer Daniel M and Hamer Rachel L
Current Estimated Value
Home Financials for this Owner
Home Financials are based on the most recent Mortgage that was taken out on this home.
Original Mortgage
$225,834
Interest Rate
5.31%
Mortgage Type
FHA
Purchase Details
Closed on
Dec 13, 2007
Sold by
Eric J Negrete Llc
Bought by
Hamer John F and Hamer Linda M
Home Financials for this Owner
Home Financials are based on the most recent Mortgage that was taken out on this home.
Original Mortgage
$215,600
Interest Rate
6.26%
Mortgage Type
Purchase Money Mortgage
Purchase Details
Closed on
May 24, 2006
Sold by
Negrete Eric J and Negrete Dionna B
Bought by
Eric J Negrete Llc
Create a Home Valuation Report for This Property
The Home Valuation Report is an in-depth analysis detailing your home's value as well as a comparison with similar homes in the area
Home Values in the Area
Average Home Value in this Area
Purchase History
| Date | Buyer | Sale Price | Title Company |
|---|---|---|---|
| Hamer Daniel M | $230,000 | Northern Nevada Title Cc | |
| Hamer John F | $287,500 | Stewart Title Douglas | |
| Eric J Negrete Llc | -- | Accommodation |
Source: Public Records
Mortgage History
| Date | Status | Borrower | Loan Amount |
|---|---|---|---|
| Open | Haker Daniel M | $260,228 | |
| Closed | Hamer Daniel M | $267,093 | |
| Closed | Hamer Daniel M | $208,078 | |
| Closed | Hamer Daniel M | $225,834 | |
| Previous Owner | Hamer John F | $215,600 |
Source: Public Records
Tax History Compared to Growth
Tax History
| Year | Tax Paid | Tax Assessment Tax Assessment Total Assessment is a certain percentage of the fair market value that is determined by local assessors to be the total taxable value of land and additions on the property. | Land | Improvement |
|---|---|---|---|---|
| 2025 | $1,880 | $65,953 | $45,500 | $20,453 |
| 2024 | $1,880 | $65,633 | $45,500 | $20,133 |
| 2023 | $1,825 | $64,076 | $45,500 | $18,576 |
| 2022 | $1,772 | $57,399 | $40,250 | $17,149 |
| 2021 | $1,720 | $52,718 | $36,750 | $15,968 |
| 2020 | $1,670 | $52,171 | $36,750 | $15,421 |
| 2019 | $1,622 | $48,134 | $33,250 | $14,884 |
| 2018 | $1,574 | $45,548 | $31,500 | $14,048 |
| 2017 | $1,528 | $45,421 | $31,500 | $13,921 |
| 2016 | $1,490 | $40,622 | $26,250 | $14,372 |
| 2015 | $1,487 | $40,622 | $26,250 | $14,372 |
| 2014 | $1,475 | $40,291 | $26,250 | $14,041 |
Source: Public Records
Map
Nearby Homes
- 1517 Mill Creek Way
- 1522 North Ct
- 1494 Hussman Ave
- 1568 County Rd
- 1480 Garden Glen Ct
- 1468 Garden Glen Ct
- 1219 Heybourne Rd
- Residence Four Plan at Kingsbury Estates
- Residence One Plan at Kingsbury Estates
- Residence Two Plan at Kingsbury Estates
- Residence Three Plan at Kingsbury Estates
- 1202 Spur Way
- 1205 Spur Way
- 1471 U S Highway 395 N Unit 2
- 1420 Douglas Ave Unit 11
- 1420 Douglas Ave Unit 4
- 1616 Belarra Dr
- 1249 Concho Trail Unit 2
- 1248 Cinch Trail Unit 3
- 1254 Concho Trail Unit 1
- 1511 Wildrose Dr
- 1118 Spruce St
- 1508 Church St
- 1109 Spruce St
- 1513 Wildrose Dr
- 1117 Spruce St
- 1107 Spruce St
- 1510 Church St
- 1098 Spruce St
- 1102 Spruce St
- 1121 Spruce St
- 1103 Spruce St
- 1515 Wildrose Dr
- 1512 Church St
- 1512 Wildrose Dr
- 1503 Deseret Dr
- 1125 Spruce St
- 1514 Wildrose Dr
- 1505 Deseret Dr
- 1505 Church St