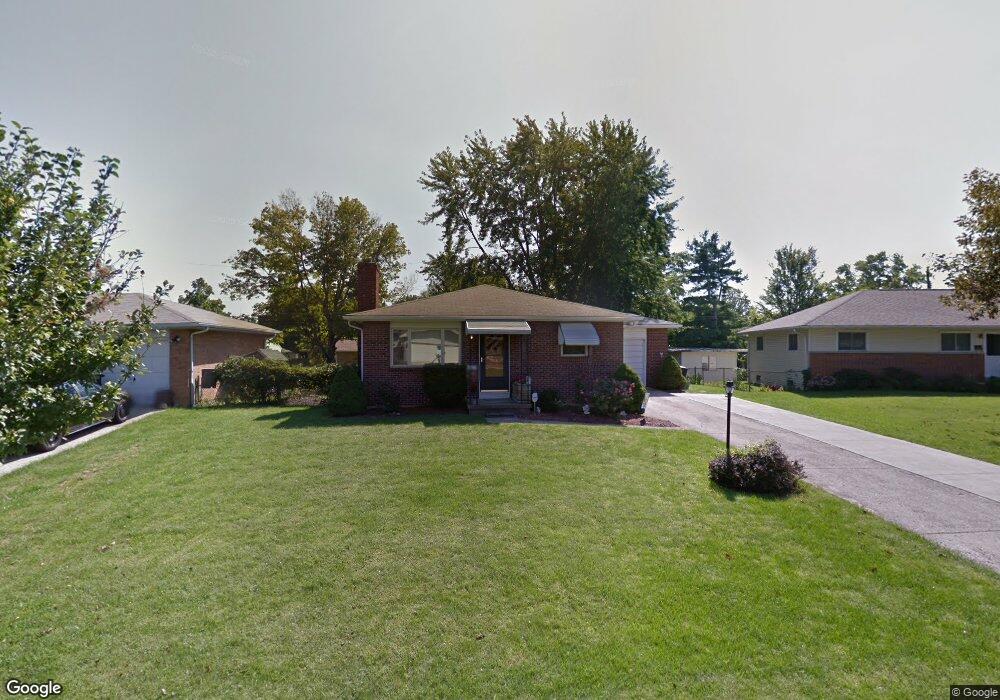
1114 St Jude Ave Columbus, OH 43204
Brookshire NeighborhoodEstimated Value: $225,000 - $239,000
3
Beds
2
Baths
1,176
Sq Ft
$196/Sq Ft
Est. Value
About This Home
This home is located at 1114 St Jude Ave, Columbus, OH 43204 and is currently estimated at $230,705, approximately $196 per square foot. 1114 St Jude Ave is a home located in Franklin County with nearby schools including Lindbergh Elementary School, Hilltonia Middle School, and Briggs High School.
Ownership History
Date
Name
Owned For
Owner Type
Purchase Details
Closed on
May 12, 2023
Sold by
Sammons Larry J and Sammons Dennise M
Bought by
Lewinsky Marianne Elizabeth
Current Estimated Value
Home Financials for this Owner
Home Financials are based on the most recent Mortgage that was taken out on this home.
Original Mortgage
$190,000
Outstanding Balance
$184,717
Interest Rate
6.39%
Mortgage Type
New Conventional
Estimated Equity
$45,988
Purchase Details
Closed on
May 29, 2008
Sold by
Mcwilliams Carrie L
Bought by
Sammons Larry J and Sammons Dennise M
Home Financials for this Owner
Home Financials are based on the most recent Mortgage that was taken out on this home.
Original Mortgage
$89,066
Interest Rate
6.09%
Mortgage Type
FHA
Purchase Details
Closed on
Mar 10, 1989
Bought by
Mcwilliams Carrie L
Create a Home Valuation Report for This Property
The Home Valuation Report is an in-depth analysis detailing your home's value as well as a comparison with similar homes in the area
Home Values in the Area
Average Home Value in this Area
Purchase History
| Date | Buyer | Sale Price | Title Company |
|---|---|---|---|
| Lewinsky Marianne Elizabeth | $220,000 | Northwest Select Title | |
| Sammons Larry J | $90,500 | Talon Group | |
| Mcwilliams Carrie L | -- | -- |
Source: Public Records
Mortgage History
| Date | Status | Borrower | Loan Amount |
|---|---|---|---|
| Open | Lewinsky Marianne Elizabeth | $190,000 | |
| Previous Owner | Sammons Larry J | $89,066 |
Source: Public Records
Tax History Compared to Growth
Tax History
| Year | Tax Paid | Tax Assessment Tax Assessment Total Assessment is a certain percentage of the fair market value that is determined by local assessors to be the total taxable value of land and additions on the property. | Land | Improvement |
|---|---|---|---|---|
| 2024 | $2,677 | $59,650 | $13,760 | $45,890 |
| 2023 | $2,643 | $59,650 | $13,760 | $45,890 |
| 2022 | $2,050 | $39,520 | $7,420 | $32,100 |
| 2021 | $2,053 | $39,520 | $7,420 | $32,100 |
| 2020 | $2,056 | $39,520 | $7,420 | $32,100 |
| 2019 | $2,018 | $33,260 | $6,200 | $27,060 |
| 2018 | $1,839 | $33,260 | $6,200 | $27,060 |
| 2017 | $1,925 | $33,260 | $6,200 | $27,060 |
| 2016 | $1,834 | $27,690 | $5,080 | $22,610 |
| 2015 | $1,665 | $27,690 | $5,080 | $22,610 |
| 2014 | $1,669 | $27,690 | $5,080 | $22,610 |
| 2013 | $969 | $32,585 | $5,985 | $26,600 |
Source: Public Records
Map
Nearby Homes
- 2610 Spaatz Ave
- 2547 Rosedale Ave
- 2743 Saint Joseph Ave
- 2588 Regina Ave
- 2743 Bernadette Rd
- 2491 Vanderberg Ave
- 2538 Vanderberg Ave
- 2530 Vanderberg Ave
- 2687 Vanderberg Ave
- 2579 Eakin Rd
- 2585 Eakin Rd
- 2436 Hardesty Dr S Unit 4
- 2856 Chesfield Dr
- 2783-2785 Vanderberg Ave
- 2367 Hardesty Dr N Unit 1-1
- 2337 Hardesty Ct Unit 1
- 2929 Briggs Rd
- 2375 Hardesty Dr N Unit A5
- 2382 Hardesty Dr S Unit Q-5
- 2334 Hardesty Ct Unit 5
- 1114 Saint Jude Ave
- 1106 Saint Jude Ave
- 1122 Saint Jude Ave
- 1125 Saint Cecelia Dr
- 1117 Saint Cecelia Dr
- 1098 Saint Jude Ave
- 1133 Saint Cecelia Dr
- 1107 Saint Cecelia Dr
- 1128 Saint Jude Ave
- 1113 Saint Jude Ave
- 1103 Saint Jude Ave
- 1143 Saint Cecelia Dr
- 1121 Saint Jude Ave
- 1090 Saint Jude Ave
- 1099 Saint Cecelia Dr
- 1093 Saint Jude Ave
- 1132 Saint Jude Ave
- 1151 Saint Cecelia Dr
- 1089 Saint Cecelia Dr
- 1085 Saint Jude Ave