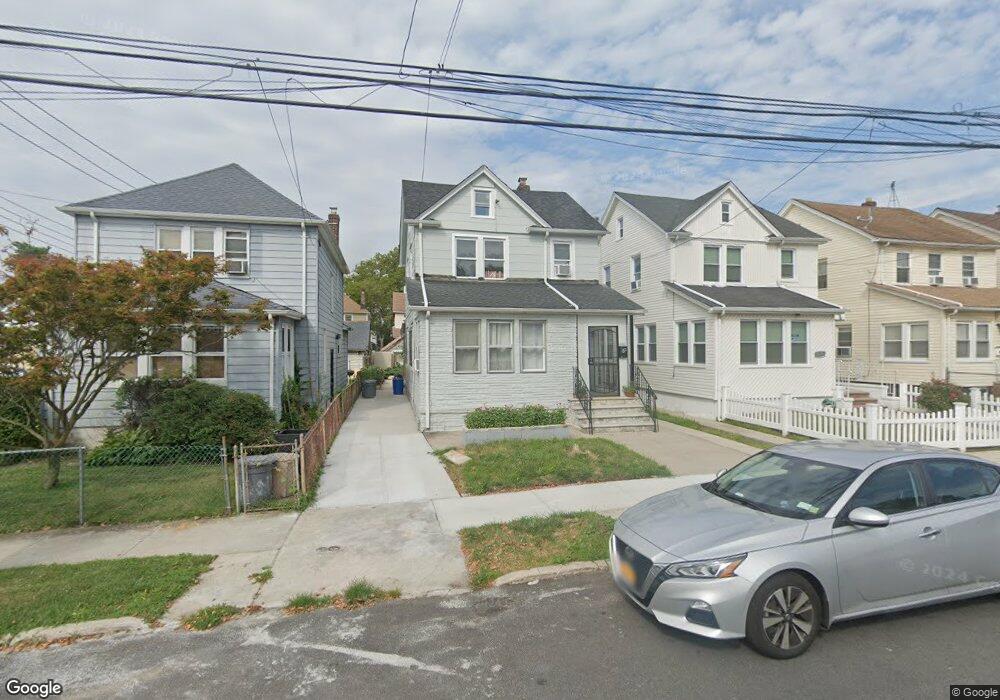
11140 208th St Queens Village, NY 11429
Queens Village NeighborhoodEstimated Value: $617,000 - $754,000
--
Bed
--
Bath
1,458
Sq Ft
$474/Sq Ft
Est. Value
About This Home
This home is located at 11140 208th St, Queens Village, NY 11429 and is currently estimated at $690,922, approximately $473 per square foot. 11140 208th St is a home located in Queens County with nearby schools including P.S. 134 Langston Hughes School, I.S. 192 The Linden, and Ss Joachim & Anne School.
Ownership History
Date
Name
Owned For
Owner Type
Purchase Details
Closed on
Dec 29, 2020
Sold by
Bala Newsstand Inc
Bought by
Eate Sarmin S and Islam Mufti M
Current Estimated Value
Home Financials for this Owner
Home Financials are based on the most recent Mortgage that was taken out on this home.
Original Mortgage
$560,500
Outstanding Balance
$500,248
Interest Rate
2.71%
Mortgage Type
Purchase Money Mortgage
Estimated Equity
$190,674
Purchase Details
Closed on
Mar 4, 2020
Sold by
Estate Of Rosalie Thurman
Bought by
Saha Tapan K
Purchase Details
Closed on
Dec 5, 2016
Sold by
Thurman John R and Thurman Roselie K
Bought by
Thurman Rosalie K
Purchase Details
Closed on
Nov 30, 2015
Sold by
Thurman Rosalie K
Bought by
Thurman John R
Purchase Details
Closed on
Mar 23, 2011
Sold by
Thurman John R and Thurman Rosalie K
Bought by
Thurman Rosalie K
Create a Home Valuation Report for This Property
The Home Valuation Report is an in-depth analysis detailing your home's value as well as a comparison with similar homes in the area
Home Values in the Area
Average Home Value in this Area
Purchase History
| Date | Buyer | Sale Price | Title Company |
|---|---|---|---|
| Eate Sarmin S | $590,000 | -- | |
| Saha Tapan K | $470,000 | -- | |
| Bala Newsstand Inc | -- | -- | |
| Thurman Rosalie K | -- | -- | |
| Thurman John R | -- | -- | |
| Thurman Rosalie K | -- | -- |
Source: Public Records
Mortgage History
| Date | Status | Borrower | Loan Amount |
|---|---|---|---|
| Open | Eate Sarmin S | $560,500 |
Source: Public Records
Tax History Compared to Growth
Tax History
| Year | Tax Paid | Tax Assessment Tax Assessment Total Assessment is a certain percentage of the fair market value that is determined by local assessors to be the total taxable value of land and additions on the property. | Land | Improvement |
|---|---|---|---|---|
| 2025 | $5,345 | $28,207 | $6,977 | $21,230 |
| 2024 | $5,345 | $26,612 | $6,379 | $20,233 |
| 2023 | $5,043 | $25,106 | $6,622 | $18,484 |
| 2022 | $4,728 | $36,600 | $9,780 | $26,820 |
| 2021 | $4,968 | $33,840 | $9,780 | $24,060 |
| 2020 | $4,976 | $29,220 | $9,780 | $19,440 |
| 2019 | $4,037 | $28,920 | $9,780 | $19,140 |
| 2018 | $3,678 | $20,922 | $8,120 | $12,802 |
| 2017 | $3,771 | $19,738 | $6,773 | $12,965 |
| 2016 | $3,385 | $19,738 | $6,773 | $12,965 |
| 2015 | $2,026 | $19,588 | $9,821 | $9,767 |
| 2014 | $2,026 | $18,481 | $9,867 | $8,614 |
Source: Public Records
Map
Nearby Homes
- 112-09 Francis Lewis Blvd
- 11210 Colfax St
- 11044 208th St
- 209-30 111th Rd
- 113-06 208th St
- 110-06 209th Place
- 109-87 Francis Lewis Blvd
- 111-39 205th St
- 110-22 207th St
- 11243 Colfax St
- 205-28 110th Ave
- 111-09 205th St
- 112-38 212th St
- 11221 212th St
- 11119 212th St
- 112-32 204th St
- 114-16 207th St
- 114-28 208th St
- 10925 208th St
- 11028 213th St
- 11140 208th St
- 11140 208th St
- 11142 208th St
- 11136 208th St
- 111-36 208th St
- 11136 208th St
- 11134 208th St
- 11132 208th St
- 11141 207th St
- 11132 208th St
- 11143 207th St
- 11139 207th St
- 11202 208th St
- 11135 207th St
- 11128 208th St
- 11139 207th St
- 11133 207th St
- 111-35 207th St
- 112-01 208th St
- 112-14 208th St