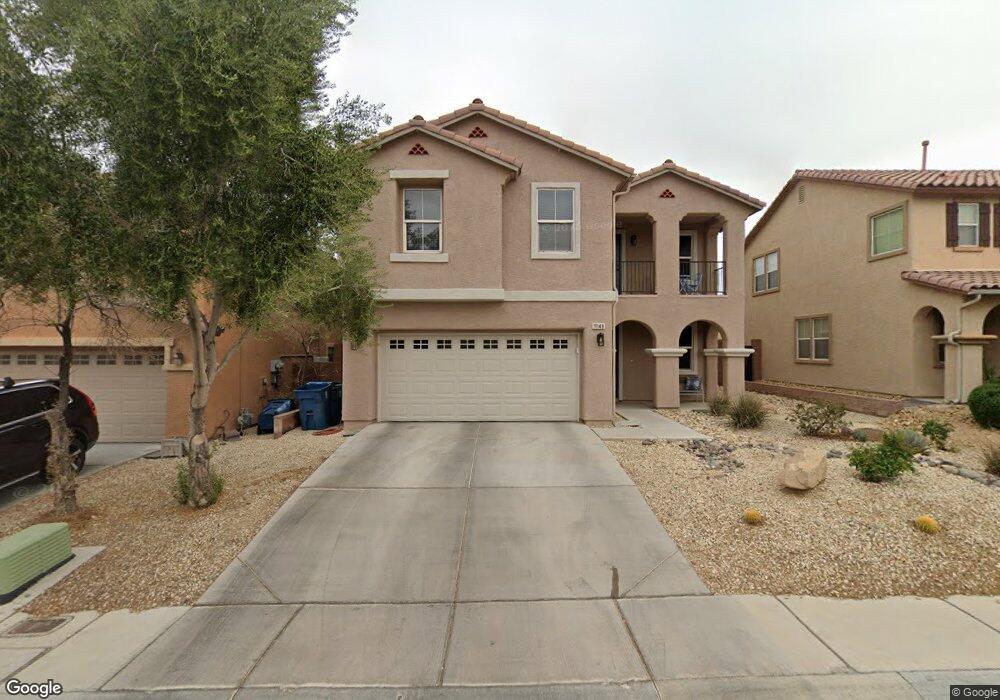
11148 Hickory Glen St Las Vegas, NV 89179
Mountains Edge NeighborhoodEstimated Value: $537,691 - $571,000
4
Beds
3
Baths
2,505
Sq Ft
$221/Sq Ft
Est. Value
About This Home
This home is located at 11148 Hickory Glen St, Las Vegas, NV 89179 and is currently estimated at $554,673, approximately $221 per square foot. 11148 Hickory Glen St is a home located in Clark County with nearby schools including Desert Oasis High School, Doral Academy West Pebble, and Doral Academy Cactus.
Ownership History
Date
Name
Owned For
Owner Type
Purchase Details
Closed on
Jul 7, 2008
Sold by
Bank Of New York
Bought by
Christiansen Cameron and Christiansen Jessica
Current Estimated Value
Home Financials for this Owner
Home Financials are based on the most recent Mortgage that was taken out on this home.
Original Mortgage
$244,594
Interest Rate
6.37%
Mortgage Type
FHA
Purchase Details
Closed on
Jan 16, 2008
Sold by
Banawa Anthony B
Bought by
Bank Of New York and Certificate Holders Cwalt Inc Alternativ
Purchase Details
Closed on
Oct 28, 2005
Sold by
Banawa Brenda
Bought by
Banawa Anthony B
Home Financials for this Owner
Home Financials are based on the most recent Mortgage that was taken out on this home.
Original Mortgage
$344,600
Interest Rate
6.5%
Mortgage Type
Unknown
Create a Home Valuation Report for This Property
The Home Valuation Report is an in-depth analysis detailing your home's value as well as a comparison with similar homes in the area
Home Values in the Area
Average Home Value in this Area
Purchase History
| Date | Buyer | Sale Price | Title Company |
|---|---|---|---|
| Christiansen Cameron | $249,000 | First American Title Paseo V | |
| Bank Of New York | $365,705 | Fidelity National Title | |
| Banawa Anthony B | -- | First Amer Title Co Of Nv | |
| Banawa Anthony B | $430,750 | First Amer Title Co Of Nv |
Source: Public Records
Mortgage History
| Date | Status | Borrower | Loan Amount |
|---|---|---|---|
| Previous Owner | Christiansen Cameron | $244,594 | |
| Previous Owner | Banawa Anthony B | $344,600 |
Source: Public Records
Tax History Compared to Growth
Tax History
| Year | Tax Paid | Tax Assessment Tax Assessment Total Assessment is a certain percentage of the fair market value that is determined by local assessors to be the total taxable value of land and additions on the property. | Land | Improvement |
|---|---|---|---|---|
| 2025 | $2,338 | $158,444 | $44,275 | $114,169 |
| 2024 | $2,270 | $158,444 | $44,275 | $114,169 |
| 2023 | $2,270 | $153,631 | $46,200 | $107,431 |
| 2022 | $2,204 | $132,776 | $34,650 | $98,126 |
| 2021 | $2,140 | $123,799 | $30,800 | $92,999 |
| 2020 | $2,075 | $122,726 | $30,800 | $91,926 |
| 2019 | $2,015 | $116,405 | $25,795 | $90,610 |
| 2018 | $1,712 | $98,204 | $19,950 | $78,254 |
| 2017 | $2,699 | $92,036 | $19,950 | $72,086 |
| 2016 | $1,622 | $79,746 | $15,050 | $64,696 |
| 2015 | $1,618 | $76,416 | $11,200 | $65,216 |
| 2014 | $1,571 | $51,967 | $6,300 | $45,667 |
Source: Public Records
Map
Nearby Homes
- 6942 Grand Junction Ave
- 11173 Hickory Glen St
- 6994 Geronimo Springs Ave
- 7012 Grand Junction Ave
- 7063 Bering Strait Ave
- 11083 Camden Bay St
- 7057 Fort Union Ct
- 7115 Hickory Post Ave
- 7055 Fort Tule Ave
- 7134 Mountain Den Ave
- 7182 Hood River Ave
- 7125 Mountain Den Ave
- 10925 Prudhoe Bay St
- 7125 Neches Ave
- 7104 Flathead River Ave
- 7286 Caballo Range Ave
- 7171 Sunny Countryside Ave
- 7397 Cobbhan Dr
- 0 W Erie Ave
- 10730 Lightning Sky St
- 11140 Hickory Glen St
- 11164 Hickory Glen St
- 11132 Hickory Glen St
- 11172 Hickory Glen St
- 6934 Geronimo Springs Ave
- 11124 Hickory Glen St
- 0 Cactus & Rainbow
- 11180 Hickory Glen St
- 11165 Hickory Glen St
- 6944 Geronimo Springs Ave Unit n
- 6944 Geronimo Springs Ave
- 6933 Grand Junction Ave
- 11173 Hickory Glen St Unit n/a
- 11188 Hickory Glen St
- 6943 Grand Junction Ave
- 11181 Hickory Glen St
- 6953 Grand Junction Ave Unit 1B
- 11168 Fort Vasquez St
- 6902 Grand Junction Ave Unit n/a
- 6902 Grand Junction Ave Unit none