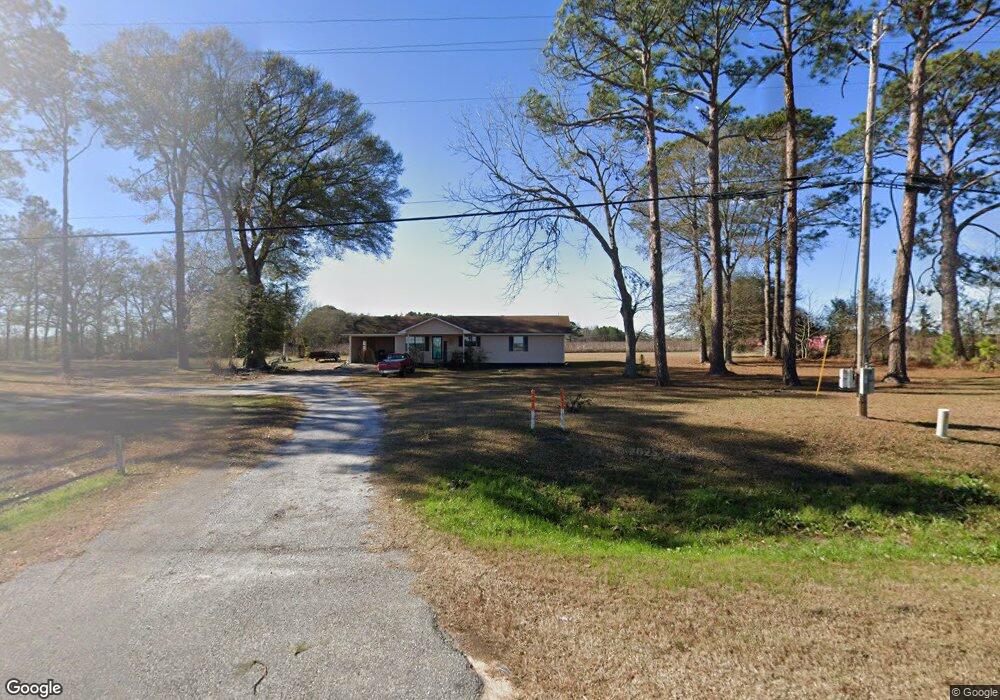
11149 Us Highway 301 Claxton, GA 30417
Estimated Value: $117,000 - $244,000
3
Beds
2
Baths
900
Sq Ft
$188/Sq Ft
Est. Value
About This Home
This home is located at 11149 Us Highway 301, Claxton, GA 30417 and is currently estimated at $169,493, approximately $188 per square foot. 11149 Us Highway 301 is a home located in Evans County with nearby schools including Claxton Elementary School, Second Chance, and Claxton Middle School.
Ownership History
Date
Name
Owned For
Owner Type
Purchase Details
Closed on
Dec 7, 2020
Sold by
Carter Cnia Martre
Bought by
Carter Charles
Current Estimated Value
Home Financials for this Owner
Home Financials are based on the most recent Mortgage that was taken out on this home.
Original Mortgage
$115,989
Interest Rate
5.99%
Mortgage Type
FHA
Purchase Details
Closed on
Mar 15, 2019
Sold by
Cook Tony
Bought by
Carter Charles and Carter Cnia Martre
Home Financials for this Owner
Home Financials are based on the most recent Mortgage that was taken out on this home.
Original Mortgage
$98,188
Interest Rate
4.5%
Mortgage Type
FHA
Purchase Details
Closed on
Mar 16, 2015
Sold by
Snider Anne L
Bought by
Cock Tony and Cook Sadie L
Purchase Details
Closed on
Jan 7, 2000
Sold by
Lewis B W
Bought by
Snider Alice Anne L and Snider
Purchase Details
Closed on
Apr 9, 1987
Sold by
Mosley Jimmy and Mosley Betty
Bought by
Eva Lewis B and Eva Mae
Create a Home Valuation Report for This Property
The Home Valuation Report is an in-depth analysis detailing your home's value as well as a comparison with similar homes in the area
Home Values in the Area
Average Home Value in this Area
Purchase History
| Date | Buyer | Sale Price | Title Company |
|---|---|---|---|
| Carter Charles | -- | -- | |
| Carter Charles | -- | -- | |
| Carter Charles | $100,000 | -- | |
| Cock Tony | $55,000 | -- | |
| Snider Alice Anne L | -- | -- | |
| Eva Lewis B | -- | -- |
Source: Public Records
Mortgage History
| Date | Status | Borrower | Loan Amount |
|---|---|---|---|
| Previous Owner | Carter Charles | $115,989 | |
| Previous Owner | Carter Charles | $98,188 |
Source: Public Records
Tax History Compared to Growth
Tax History
| Year | Tax Paid | Tax Assessment Tax Assessment Total Assessment is a certain percentage of the fair market value that is determined by local assessors to be the total taxable value of land and additions on the property. | Land | Improvement |
|---|---|---|---|---|
| 2024 | $1,100 | $37,332 | $3,000 | $34,332 |
| 2023 | $698 | $23,480 | $5,560 | $17,920 |
| 2022 | $603 | $23,480 | $5,560 | $17,920 |
| 2021 | $863 | $23,480 | $5,560 | $17,920 |
| 2020 | $862 | $23,480 | $5,560 | $17,920 |
| 2019 | $840 | $23,480 | $5,560 | $17,920 |
| 2018 | $881 | $23,200 | $5,560 | $17,640 |
| 2017 | $852 | $23,480 | $5,560 | $17,920 |
| 2016 | $826 | $21,760 | $4,240 | $17,520 |
| 2015 | -- | $22,000 | $4,240 | $17,760 |
| 2014 | -- | $22,236 | $4,240 | $17,996 |
| 2013 | -- | $22,476 | $4,240 | $18,236 |
Source: Public Records
Map
Nearby Homes
- 11959 U S 301
- 19410 Georgia 169
- 0 Mosley Rd Unit 10630884
- 0 Hendrix Bridge Rd
- 3156 Sterling Rd
- 17939 Ga Hwy 169 Hwy
- 304 Mt Pleasant Rd
- 0 Waters Ln Unit LOT 6
- 0 Waters Ln Unit LOT 5
- 0 Waters Ln Unit LOT 3
- 0 Waters Ln Unit LOT 4
- 2571 Edgar Hodges Rd
- 0 Dr
- 326 N River St
- 320 N Duval St
- 1377 Hillside Dr
- 0 George Strickland Rd Unit 10626764
- 0 Ga Hwy 129 N Unit 10564606
- 12 S Duval St
- 107 E Liberty St
- 11149 U S 301
- 11204 Us Highway 301 N
- 11314 Us Highway 301 N
- 11314 Us Highway 301 N
- 11315 Us Highway 301 N
- 10856 Us Highway 301
- 288 Mosley Rd
- 451 Mosley Rd
- 11640 Us Highway 301 N
- 11694 Us Highway 301 N
- 11712 Us Highway 301 N
- 11712 Us Highway 301 N
- 223 Beasley Farm Rd
- 11722 Us Highway 301 N
- 11831 Us Highway 301 N
- 143 Mitchell Ln
- 396 Red Clay Rd
- 396 Red Clay Rd
- D Dn Beasley Rd
- 11917 U S 301