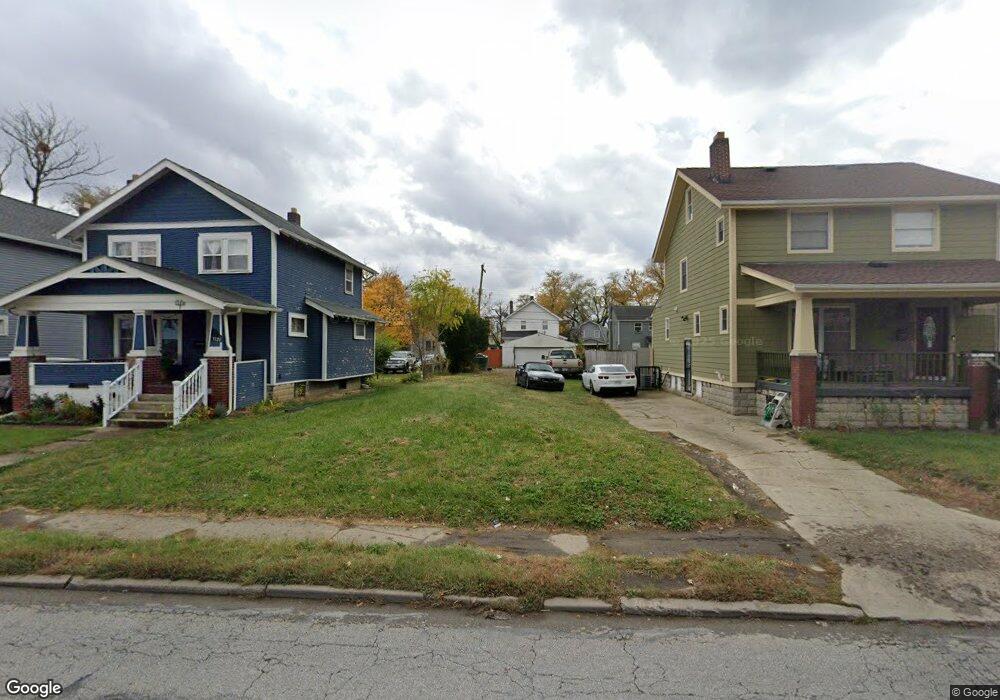
1115-1117 E 17th Ave Columbus, OH 43211
South Linden NeighborhoodEstimated Value: $60,000
6
Beds
2
Baths
2,352
Sq Ft
$26/Sq Ft
Est. Value
About This Home
This home is located at 1115-1117 E 17th Ave, Columbus, OH 43211 and is currently priced at $60,000, approximately $25 per square foot. 1115-1117 E 17th Ave is a home located in Franklin County with nearby schools including Windsor Stem Acadmey, Linden-Mckinley Stem School On Arcadia, and North Columbus Preparatory Academy.
Ownership History
Date
Name
Owned For
Owner Type
Purchase Details
Closed on
Nov 22, 2017
Sold by
Bosomtwi Kwabena
Bought by
Central Ohio Community Improvement Corp
Current Estimated Value
Purchase Details
Closed on
Oct 13, 2016
Sold by
Thomas Stephen
Bought by
Bosomaton Kawbena
Purchase Details
Closed on
Sep 24, 2012
Sold by
Yador Patigene
Bought by
Bosomtwi Kwabena
Purchase Details
Closed on
May 21, 2010
Sold by
Thomas Stephanie L
Bought by
Robinson James L
Purchase Details
Closed on
May 12, 2008
Sold by
Dejarnett Horace and Leonard Edward
Bought by
Thomas Stephanie L
Purchase Details
Closed on
Nov 9, 1960
Bought by
Dejarnett Horace
Create a Home Valuation Report for This Property
The Home Valuation Report is an in-depth analysis detailing your home's value as well as a comparison with similar homes in the area
Home Values in the Area
Average Home Value in this Area
Purchase History
We collect this data history from publicly available records. To have your information removed, we recommend requesting removal directly through your county’s website.
| Date | Buyer | Sale Price | Title Company |
|---|---|---|---|
| Central Ohio Community Improvement Corp | -- | None Available | |
| Bosomaton Kawbena | $16,800 | None Available | |
| Bosomtwi Kwabena | -- | None Available | |
| Robinson James L | $22,500 | None Available | |
| Thomas Stephanie L | $14,000 | None Available | |
| Dejarnett Horace | -- | -- |
Source: Public Records
Tax History
| Year | Tax Paid | Tax Assessment Tax Assessment Total Assessment is a certain percentage of the fair market value that is determined by local assessors to be the total taxable value of land and additions on the property. | Land | Improvement |
|---|---|---|---|---|
| 2025 | -- | $5,320 | $5,320 | -- |
| 2024 | -- | $5,320 | $5,320 | -- |
| 2023 | $0 | $5,320 | $5,320 | $0 |
| 2022 | $0 | $2,210 | $2,210 | $0 |
| 2021 | $0 | $2,210 | $2,210 | $0 |
| 2020 | $0 | $2,210 | $2,210 | $0 |
| 2019 | $500 | $1,860 | $1,860 | $0 |
| 2018 | $1,416 | $14,110 | $1,860 | $12,250 |
| 2017 | $1,572 | $14,110 | $1,860 | $12,250 |
| 2016 | $5,664 | $11,730 | $2,100 | $9,630 |
| 2015 | $2,333 | $11,730 | $2,100 | $9,630 |
| 2014 | $727 | $11,730 | $2,100 | $9,630 |
| 2013 | $689 | $13,055 | $2,345 | $10,710 |
Source: Public Records
Map
Nearby Homes
- 1129 E 17th Ave
- 1111-1113 E 16th Ave
- 1070 E 16th Ave
- 1673 Cleveland Ave
- 1157-1159 E 18th Ave
- 1074 E 15th Ave
- 1078 E 19th Ave
- 1027 E 14th Ave
- 1029 E 19th Ave
- 1024 E 13th Ave
- 1111 Windsor Ave
- 1121 Windsor Ave
- 1249-1251 E 15th Ave
- 1315 E 18th Ave
- 927 E 18th Ave
- 957 E 13th Ave
- 934 E 13th Ave
- 1900-1904 Hamilton Ave
- 1107 E 22nd Ave
- 1258 E 21st Ave
- 1115 E 17th Ave Unit 117
- 1111 E 17th Ave
- 1121 E 17th Ave
- 1107 E 17th Ave
- 1125 E 17th Ave
- 1101 E 17th Ave
- 1110 E 16th Ave
- 1116 E 16th Ave
- 1102 E 16th Ave Unit 104
- 1102 E 16th Ave Unit 104
- 1102 E 16th Ave
- 1133 E 17th Ave
- 1120 E 16th Ave
- 1116 E 17th Ave
- 1124 E 16th Ave
- 1093 E 17th Ave
- 1137 E 17th Ave Unit 139
- 1122 E 17th Ave
- 1110 E 17th Ave Unit 112
- 1110 E 17th Ave Unit 12
Your Personal Tour Guide
Ask me questions while you tour the home.