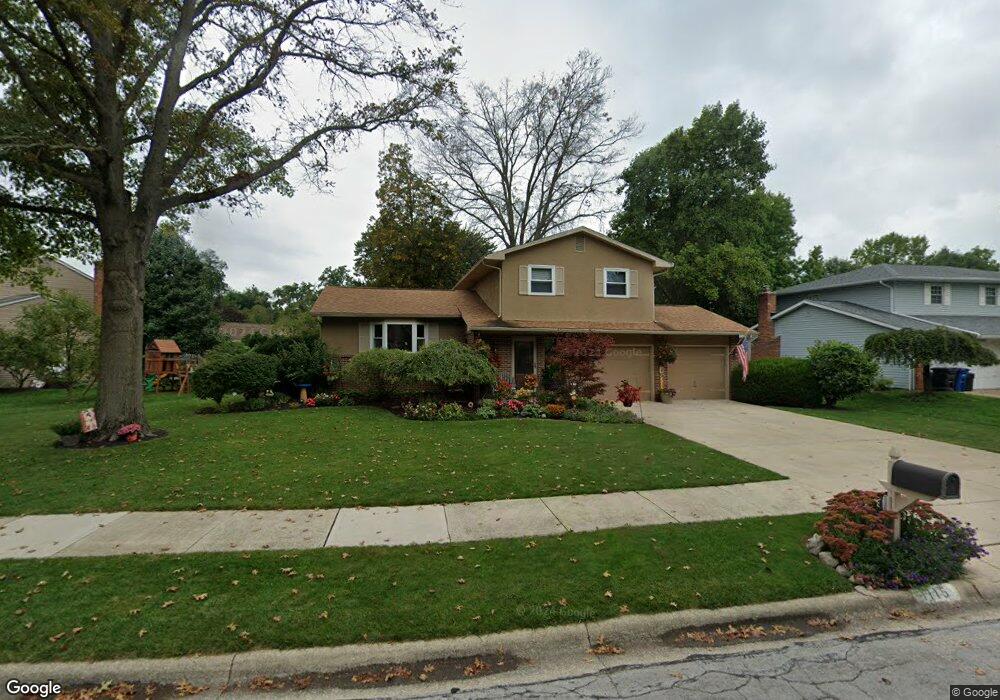
1115 Arundel Ave Westerville, OH 43081
Estimated Value: $346,000 - $449,650
3
Beds
3
Baths
2,005
Sq Ft
$205/Sq Ft
Est. Value
About This Home
This home is located at 1115 Arundel Ave, Westerville, OH 43081 and is currently estimated at $411,163, approximately $205 per square foot. 1115 Arundel Ave is a home located in Franklin County with nearby schools including Annehurst Elementary School, Heritage Middle School, and Westerville South High School.
Ownership History
Date
Name
Owned For
Owner Type
Purchase Details
Closed on
Mar 3, 2025
Sold by
Boca Rentals Llc
Bought by
Arundel Ave Llc
Current Estimated Value
Purchase Details
Closed on
Jul 7, 2023
Sold by
Boca Holdings Llc
Bought by
Boca Rentals Llc
Purchase Details
Closed on
Oct 28, 2021
Sold by
Biliman Kristy L and Biliman Paul Kristy
Bought by
Boca Holdings Llc
Purchase Details
Closed on
Sep 28, 2010
Sold by
Jursek Philip D and Randolph Carolyn E
Bought by
Billman Kristy L
Home Financials for this Owner
Home Financials are based on the most recent Mortgage that was taken out on this home.
Original Mortgage
$161,721
Interest Rate
4.37%
Mortgage Type
FHA
Purchase Details
Closed on
Oct 16, 1985
Bought by
Jursek Phillip D
Purchase Details
Closed on
May 1, 1979
Create a Home Valuation Report for This Property
The Home Valuation Report is an in-depth analysis detailing your home's value as well as a comparison with similar homes in the area
Home Values in the Area
Average Home Value in this Area
Purchase History
| Date | Buyer | Sale Price | Title Company |
|---|---|---|---|
| Arundel Ave Llc | $303,400 | None Listed On Document | |
| Boca Rentals Llc | -- | None Listed On Document | |
| Boca Holdings Llc | $400,000 | Great American Title | |
| Billman Kristy L | -- | Talon Group | |
| Jursek Phillip D | $85,900 | -- | |
| -- | $63,500 | -- |
Source: Public Records
Mortgage History
| Date | Status | Borrower | Loan Amount |
|---|---|---|---|
| Previous Owner | Billman Kristy L | $161,721 |
Source: Public Records
Tax History Compared to Growth
Tax History
| Year | Tax Paid | Tax Assessment Tax Assessment Total Assessment is a certain percentage of the fair market value that is determined by local assessors to be the total taxable value of land and additions on the property. | Land | Improvement |
|---|---|---|---|---|
| 2024 | $6,328 | $106,190 | $29,750 | $76,440 |
| 2023 | $6,051 | $106,190 | $29,750 | $76,440 |
| 2022 | $10,598 | $140,010 | $21,950 | $118,060 |
| 2021 | $6,246 | $80,890 | $21,950 | $58,940 |
| 2020 | $6,027 | $80,890 | $21,950 | $58,940 |
| 2019 | $5,577 | $70,570 | $21,950 | $48,620 |
| 2018 | $5,056 | $70,570 | $21,950 | $48,620 |
| 2017 | $5,142 | $70,570 | $21,950 | $48,620 |
| 2016 | $4,898 | $58,420 | $20,370 | $38,050 |
| 2015 | $4,744 | $58,420 | $20,370 | $38,050 |
| 2014 | $4,747 | $58,420 | $20,370 | $38,050 |
| 2013 | $2,370 | $58,415 | $20,370 | $38,045 |
Source: Public Records
Map
Nearby Homes
- 106 Ormsbee Ave
- 258 Bellefield Ave
- 1095 Belle Meade Place
- 7691 Key Deer Dr
- 7685 Key Deer Dr Unit 7685
- 828 Memories Ln
- 953 Arcadia Blvd
- 1024 Arcadia Blvd
- 1585 Fawn Ct
- 774 W Main St
- 8278 Mira St Unit 154
- 8282 Mira St Unit 153
- 671 College Crest Rd
- 658 River Trace
- 640 Glacier Pass
- 8292 Carano Way Unit 39
- 7852 Heathcock Ct
- 1296 Blacksmith Dr
- 1192 Blacksmith Dr
- 101 W Ticonderoga Dr Unit B
- 1107 Arundel Ave
- 1123 Arundel Ave
- 82 Ormsbee Ave
- 1101 Arundel Ave
- 90 Ormsbee Ave
- 120 Crowles Ave
- 1110 Arundel Ave
- 1114 Arundel Ave
- 1104 Arundel Ave
- 64 Ormsbee Ave
- 1118 Arundel Ave
- 126 Crowles Ave
- 96 Ormsbee Ave
- 1095 Arundel Ave
- 1098 Arundel Ave
- 58 Ormsbee Ave
- 132 Crowles Ave
- 951 Danvers Ave
- 943 Danvers Ave
- 81 Ormsbee Ave