Estimated Value: $192,000 - $245,000
4
Beds
2
Baths
2,156
Sq Ft
$100/Sq Ft
Est. Value
About This Home
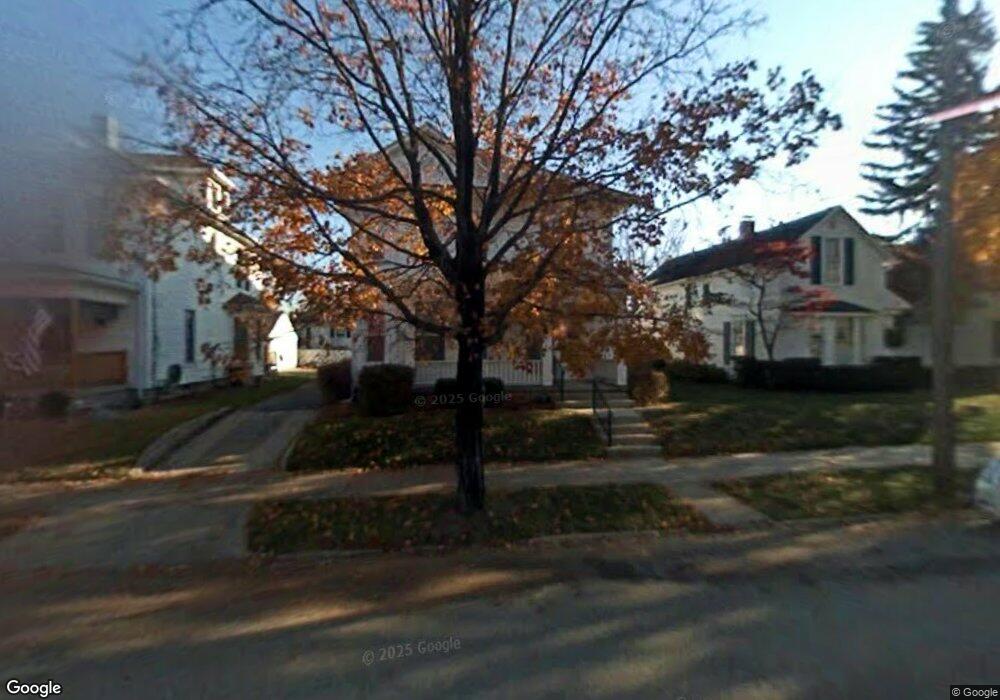
This home is located at 1115 Broadway, Piqua, OH 45356 and is currently estimated at $215,637, approximately $100 per square foot. 1115 Broadway is a home located in Miami County with nearby schools including Piqua Central Intermediate School, Springcreek Primary School, and Piqua Junior High School.
Ownership History
Date
Name
Owned For
Owner Type
Purchase Details
Closed on
Apr 27, 2017
Sold by
Riley Micheal J
Bought by
1115 Broadway Llc
Current Estimated Value
Purchase Details
Closed on
Sep 4, 2009
Sold by
Nationstar Mortgage Llc
Bought by
Riley Michael J
Purchase Details
Closed on
Feb 23, 2009
Sold by
Rolf Brian P
Bought by
Nationstar Mortgage Llc
Purchase Details
Closed on
Oct 3, 2003
Sold by
Frigge Thomas R and Frigge Rebecca J
Bought by
Rolf Rachel A and Rolf Brian P
Purchase Details
Closed on
May 20, 1992
Bought by
Frigge Thomas R
Create a Home Valuation Report for This Property
The Home Valuation Report is an in-depth analysis detailing your home's value as well as a comparison with similar homes in the area
Home Values in the Area
Average Home Value in this Area
Purchase History
| Date | Buyer | Sale Price | Title Company |
|---|---|---|---|
| 1115 Broadway Llc | -- | None Available | |
| Riley Michael J | $52,500 | -- | |
| Nationstar Mortgage Llc | $87,375 | -- | |
| Rolf Rachel A | $110,000 | -- | |
| Frigge Thomas R | $65,000 | -- |
Source: Public Records
Tax History Compared to Growth
Tax History
| Year | Tax Paid | Tax Assessment Tax Assessment Total Assessment is a certain percentage of the fair market value that is determined by local assessors to be the total taxable value of land and additions on the property. | Land | Improvement |
|---|---|---|---|---|
| 2024 | $2,254 | $53,450 | $7,250 | $46,200 |
| 2023 | $2,254 | $53,450 | $7,250 | $46,200 |
| 2022 | $2,293 | $53,450 | $7,250 | $46,200 |
| 2021 | $1,922 | $41,100 | $5,570 | $35,530 |
| 2020 | $1,889 | $41,100 | $5,570 | $35,530 |
| 2019 | $1,899 | $41,100 | $5,570 | $35,530 |
| 2018 | $927 | $19,120 | $5,850 | $13,270 |
| 2017 | $913 | $19,120 | $5,850 | $13,270 |
| 2016 | $903 | $19,120 | $5,850 | $13,270 |
| 2015 | $888 | $18,380 | $5,640 | $12,740 |
| 2014 | $888 | $18,380 | $5,640 | $12,740 |
| 2013 | $891 | $18,380 | $5,640 | $12,740 |
Source: Public Records
Map
Nearby Homes