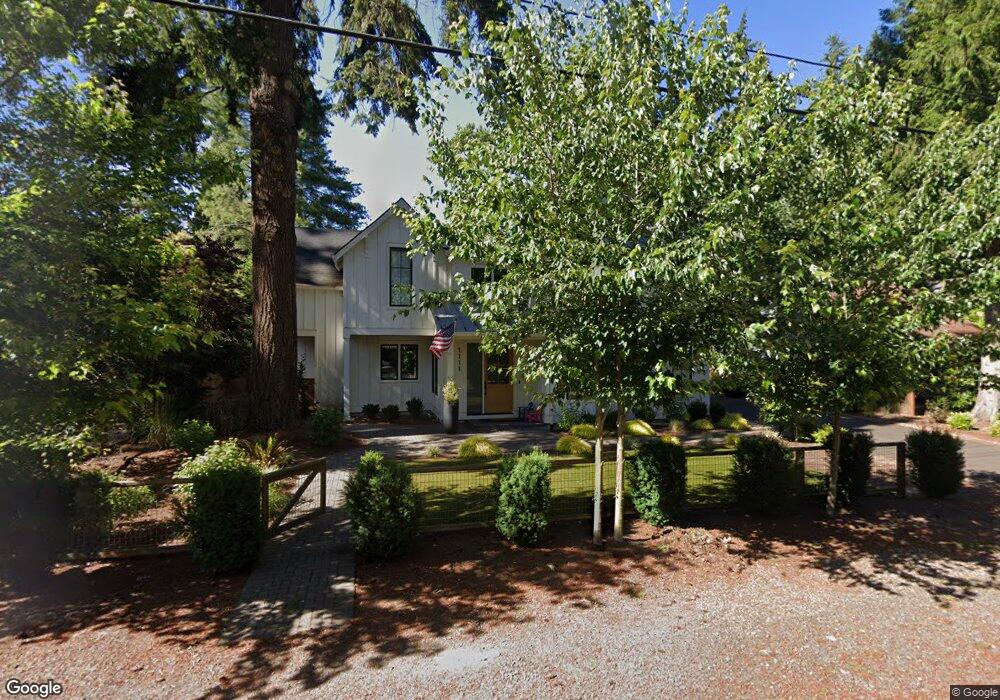
1115 C Ave Lake Oswego, OR 97034
Evergreen NeighborhoodEstimated Value: $1,861,000 - $2,062,331
4
Beds
4
Baths
3,343
Sq Ft
$598/Sq Ft
Est. Value
About This Home
This home is located at 1115 C Ave, Lake Oswego, OR 97034 and is currently estimated at $1,998,833, approximately $597 per square foot. 1115 C Ave is a home located in Clackamas County with nearby schools including Forest Hills Elementary School, Lake Oswego Junior High School, and Lake Oswego Senior High School.
Ownership History
Date
Name
Owned For
Owner Type
Purchase Details
Closed on
Feb 9, 2021
Sold by
Blue Palouse Properties Llc
Bought by
Francis Gretchen Anne and Francis Craig Robert
Current Estimated Value
Home Financials for this Owner
Home Financials are based on the most recent Mortgage that was taken out on this home.
Original Mortgage
$1,050,000
Outstanding Balance
$935,307
Interest Rate
2.6%
Mortgage Type
New Conventional
Estimated Equity
$1,063,526
Purchase Details
Closed on
Sep 16, 2019
Sold by
Rise James D
Bought by
Blue Palouse Properties Llc
Home Financials for this Owner
Home Financials are based on the most recent Mortgage that was taken out on this home.
Original Mortgage
$675,000
Interest Rate
3.7%
Mortgage Type
Commercial
Create a Home Valuation Report for This Property
The Home Valuation Report is an in-depth analysis detailing your home's value as well as a comparison with similar homes in the area
Home Values in the Area
Average Home Value in this Area
Purchase History
| Date | Buyer | Sale Price | Title Company |
|---|---|---|---|
| Francis Gretchen Anne | $1,500,000 | Lawyers Title | |
| Blue Palouse Properties Llc | $900,000 | Lawyers |
Source: Public Records
Mortgage History
| Date | Status | Borrower | Loan Amount |
|---|---|---|---|
| Open | Francis Gretchen Anne | $1,050,000 | |
| Previous Owner | Blue Palouse Properties Llc | $675,000 |
Source: Public Records
Tax History Compared to Growth
Tax History
| Year | Tax Paid | Tax Assessment Tax Assessment Total Assessment is a certain percentage of the fair market value that is determined by local assessors to be the total taxable value of land and additions on the property. | Land | Improvement |
|---|---|---|---|---|
| 2025 | $19,282 | $1,006,246 | -- | -- |
| 2024 | $18,768 | $976,938 | -- | -- |
| 2023 | $18,768 | $948,484 | $0 | $0 |
| 2022 | $17,676 | $920,859 | $0 | $0 |
| 2021 | $17,542 | $960,771 | $0 | $0 |
| 2020 | $3,504 | $191,133 | $0 | $0 |
| 2019 | $5,380 | $292,081 | $0 | $0 |
| 2018 | $5,116 | $283,574 | $0 | $0 |
| 2017 | $4,936 | $275,315 | $0 | $0 |
| 2016 | $4,493 | $267,296 | $0 | $0 |
| 2015 | $4,341 | $259,511 | $0 | $0 |
| 2014 | $3,653 | $214,798 | $0 | $0 |
Source: Public Records
Map
Nearby Homes