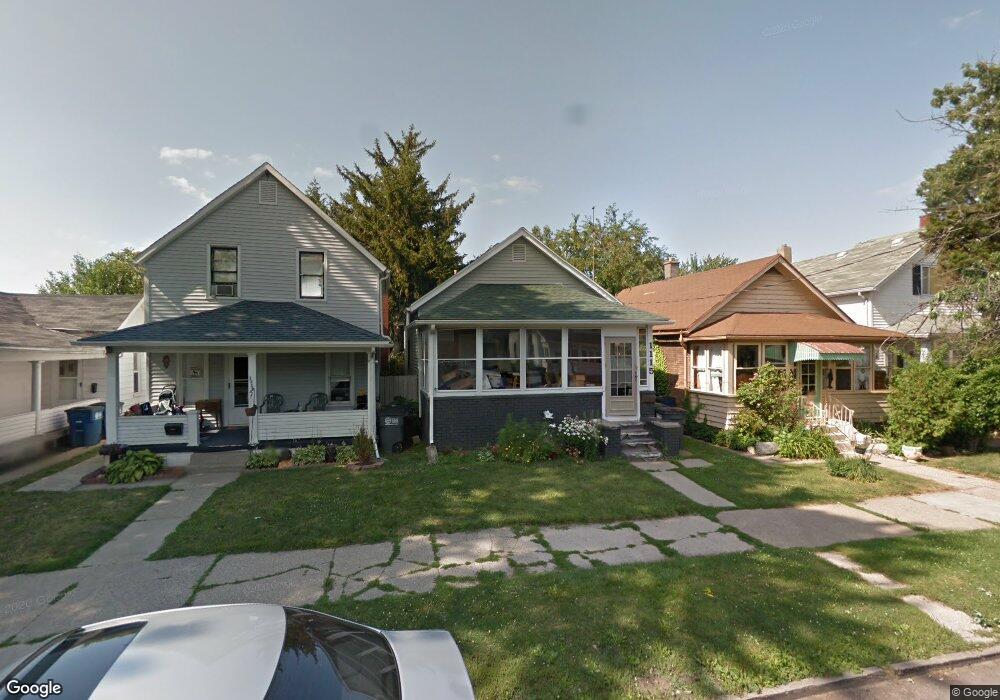
1115 Camden St Toledo, OH 43605
East Toledo NeighborhoodEstimated Value: $43,000 - $83,000
2
Beds
1
Bath
878
Sq Ft
$67/Sq Ft
Est. Value
About This Home
This home is located at 1115 Camden St, Toledo, OH 43605 and is currently estimated at $58,571, approximately $66 per square foot. 1115 Camden St is a home located in Lucas County with nearby schools including East Broadway Elementary School, Waite High School, and Kenmore Preparatory Academy dba Toledo Preparatory Academy.
Ownership History
Date
Name
Owned For
Owner Type
Purchase Details
Closed on
Aug 24, 2005
Sold by
Smith Heidi Mclaughlin and Mohon Holly
Bought by
Stork Brian and Cousino Karen
Current Estimated Value
Purchase Details
Closed on
Jun 6, 2003
Sold by
Mohon Holly A and Smith Heidi L
Bought by
Stork Brian
Home Financials for this Owner
Home Financials are based on the most recent Mortgage that was taken out on this home.
Original Mortgage
$30,000
Interest Rate
5.88%
Mortgage Type
Seller Take Back
Purchase Details
Closed on
Apr 10, 2003
Sold by
Smith Robert R
Bought by
Smith Heidi and Mohon Holly
Home Financials for this Owner
Home Financials are based on the most recent Mortgage that was taken out on this home.
Original Mortgage
$30,000
Interest Rate
5.88%
Mortgage Type
Seller Take Back
Purchase Details
Closed on
Jan 28, 1994
Sold by
Forbes Marcella
Purchase Details
Closed on
Aug 24, 1989
Sold by
Forbes P A and M A
Create a Home Valuation Report for This Property
The Home Valuation Report is an in-depth analysis detailing your home's value as well as a comparison with similar homes in the area
Home Values in the Area
Average Home Value in this Area
Purchase History
| Date | Buyer | Sale Price | Title Company |
|---|---|---|---|
| Stork Brian | $30,000 | -- | |
| Stork Brian | $30,000 | -- | |
| Smith Heidi | -- | -- | |
| -- | $25,000 | -- | |
| -- | -- | -- |
Source: Public Records
Mortgage History
| Date | Status | Borrower | Loan Amount |
|---|---|---|---|
| Previous Owner | Stork Brian | $30,000 |
Source: Public Records
Tax History Compared to Growth
Tax History
| Year | Tax Paid | Tax Assessment Tax Assessment Total Assessment is a certain percentage of the fair market value that is determined by local assessors to be the total taxable value of land and additions on the property. | Land | Improvement |
|---|---|---|---|---|
| 2024 | $364 | $10,290 | $3,850 | $6,440 |
| 2023 | $658 | $8,750 | $3,395 | $5,355 |
| 2022 | $653 | $8,750 | $3,395 | $5,355 |
| 2021 | $648 | $8,750 | $3,395 | $5,355 |
| 2020 | $649 | $7,525 | $2,870 | $4,655 |
| 2019 | $627 | $7,525 | $2,870 | $4,655 |
| 2018 | $625 | $7,525 | $2,870 | $4,655 |
| 2017 | $627 | $6,965 | $3,535 | $3,430 |
| 2016 | $611 | $19,900 | $10,100 | $9,800 |
| 2015 | $586 | $19,900 | $10,100 | $9,800 |
| 2014 | $430 | $6,830 | $3,470 | $3,360 |
| 2013 | $430 | $6,830 | $3,470 | $3,360 |
Source: Public Records
Map
Nearby Homes
- 1204 Navarre Ave
- 734 Parker Ave
- 1301 Ellis Ave
- 737-739 Forsythe St
- 1012 Idaho St
- 702 E Broadway St
- 1308 Halstead St
- 643 Willard St
- 852 Berry St
- 949 Forsythe St
- 636 White St
- 610 Parker Ave
- 1024 Earl St
- 1202 Nevada St
- 715 Raymer Blvd
- 1207 Nevada St
- 920 Rogers St
- 1418 Nevada St
- 921 Butler St
- 527 White St
- 1107 Camden St
- 1113 Camden St
- 1109 Camden St
- 1111 Camden St
- 1121 Camden St
- 1029 Camden St
- 1027 Camden St
- 1125 Camden St
- 1106 Navarre Ave
- 1104 Navarre Ave
- 1110 Navarre Ave
- 1030 Navarre Ave
- 1106 Camden St
- 1021 Camden St
- 1127 Camden St
- 1118 Navarre Ave
- 1108 Camden St
- 1028 Navarre Ave
- 1119 Halstead St
- 1113 Halstead St