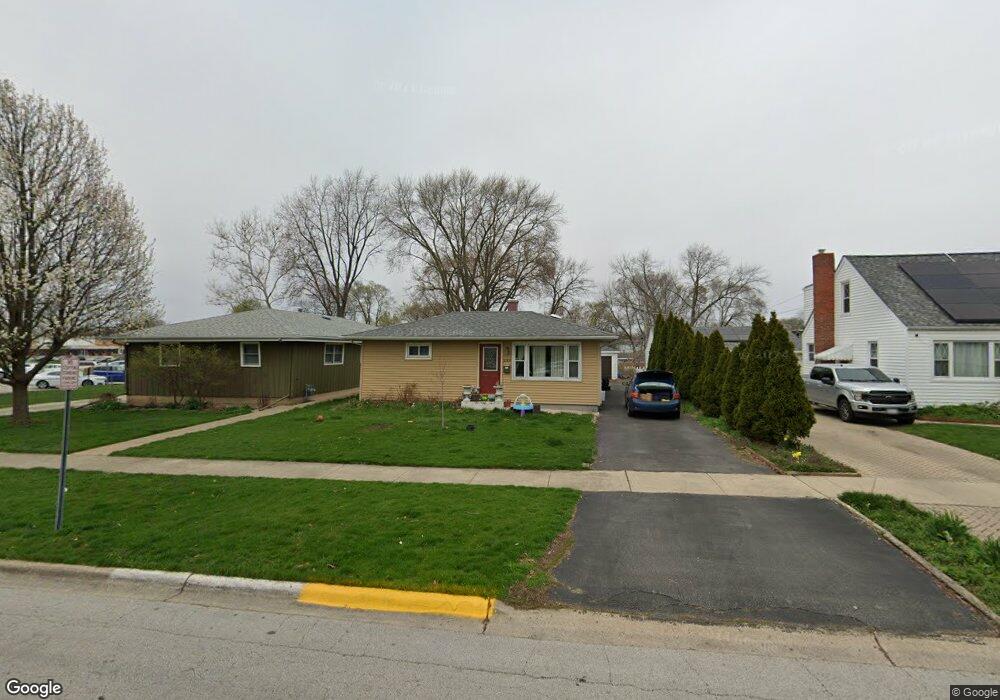
1115 Charles St Aurora, IL 60506
Blackhawk NeighborhoodEstimated Value: $247,698 - $262,000
2
Beds
1
Bath
832
Sq Ft
$306/Sq Ft
Est. Value
About This Home
This home is located at 1115 Charles St, Aurora, IL 60506 and is currently estimated at $254,425, approximately $305 per square foot. 1115 Charles St is a home located in Kane County with nearby schools including Mccleery Elementary School, Jefferson Middle School, and West Aurora High School.
Ownership History
Date
Name
Owned For
Owner Type
Purchase Details
Closed on
Apr 4, 2002
Sold by
Luna Eulalia
Bought by
Valdez Rolando Trevino and Trevino Rolando
Current Estimated Value
Home Financials for this Owner
Home Financials are based on the most recent Mortgage that was taken out on this home.
Original Mortgage
$76,500
Interest Rate
6.82%
Purchase Details
Closed on
Apr 17, 1997
Sold by
Shay Theodore M and Shay Marybeth L
Bought by
Valdez Rolando Trevino and Luna Eulalia
Home Financials for this Owner
Home Financials are based on the most recent Mortgage that was taken out on this home.
Original Mortgage
$77,710
Interest Rate
7.93%
Mortgage Type
FHA
Purchase Details
Closed on
Sep 9, 1996
Sold by
The Old Second National Bank Of Aurora
Bought by
Shay Marybeth L and Shay Theodore M
Create a Home Valuation Report for This Property
The Home Valuation Report is an in-depth analysis detailing your home's value as well as a comparison with similar homes in the area
Home Values in the Area
Average Home Value in this Area
Purchase History
| Date | Buyer | Sale Price | Title Company |
|---|---|---|---|
| Valdez Rolando Trevino | -- | Law Title Insurance Co Inc | |
| Valdez Rolando Trevino | $78,000 | Law Title Insurance Co Inc | |
| Shay Marybeth L | $64,000 | Lawyers Title Insurance Co |
Source: Public Records
Mortgage History
| Date | Status | Borrower | Loan Amount |
|---|---|---|---|
| Closed | Valdez Rolando Trevino | $76,500 | |
| Previous Owner | Valdez Rolando Trevino | $77,710 |
Source: Public Records
Tax History Compared to Growth
Tax History
| Year | Tax Paid | Tax Assessment Tax Assessment Total Assessment is a certain percentage of the fair market value that is determined by local assessors to be the total taxable value of land and additions on the property. | Land | Improvement |
|---|---|---|---|---|
| 2024 | $4,357 | $63,028 | $9,246 | $53,782 |
| 2023 | $4,138 | $56,315 | $8,261 | $48,054 |
| 2022 | $4,017 | $51,382 | $7,537 | $43,845 |
| 2021 | $3,822 | $47,837 | $7,017 | $40,820 |
| 2020 | $3,598 | $44,434 | $6,518 | $37,916 |
| 2019 | $3,439 | $41,169 | $6,039 | $35,130 |
| 2018 | $2,976 | $35,815 | $5,586 | $30,229 |
| 2017 | $2,779 | $32,998 | $5,147 | $27,851 |
| 2016 | $2,453 | $29,090 | $4,412 | $24,678 |
| 2015 | -- | $25,193 | $3,794 | $21,399 |
| 2014 | -- | $24,067 | $3,487 | $20,580 |
| 2013 | -- | $25,147 | $3,507 | $21,640 |
Source: Public Records
Map
Nearby Homes
- 943 Charles St
- 930 W New York St Unit 932
- 900 Charles St
- 931 W Downer Place
- 850 W Galena Blvd
- 809 W Park Ave
- 616 Morton Ave
- 1104 New Haven Ave
- 231 W Downer Place
- 781 N Elmwood Dr
- 1351 Monomoy St Unit D
- 149 S Gladstone Ave
- 795 N Elmwood Dr
- 710 W Downer Place
- 175 S Harrison Ave
- 164 S Calumet Ave
- 1389 Monomoy St Unit B2
- 833 N Randall Rd Unit C4
- 237 Ingleside Ave
- 203 S Calumet Ave
- 1121 Charles St
- 1111 Charles St
- 375 N Commonwealth Ave
- 407 N Commonwealth Ave
- 302 N Fordham Ave
- 402 N Fordham Ave
- 411 N Commonwealth Ave
- 404 N Fordham Ave
- 1110 Charles St
- 406 N Fordham Ave
- 216 N Fordham Ave
- 410 N Fordham Ave
- 1112 Plum St
- 1116 Plum St
- 1043 Charles St
- 1120 Plum St
- 414 N Fordham Ave
- 1041 Charles St
- 1041 Charles St
- 416 N Fordham Ave