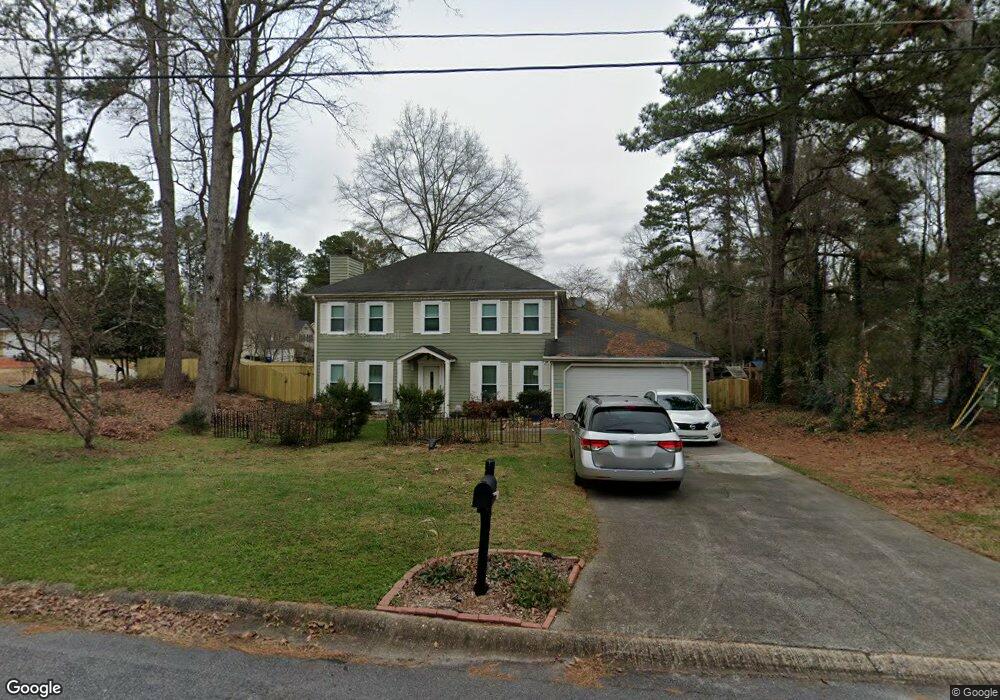
1115 Chipwood Path Unit 2 Tucker, GA 30084
Pittsburg NeighborhoodEstimated Value: $384,000 - $419,000
4
Beds
3
Baths
1,872
Sq Ft
$214/Sq Ft
Est. Value
About This Home
This home is located at 1115 Chipwood Path Unit 2, Tucker, GA 30084 and is currently estimated at $400,850, approximately $214 per square foot. 1115 Chipwood Path Unit 2 is a home located in Gwinnett County with nearby schools including Nesbit Elementary School, Lilburn Middle School, and Meadowcreek High School.
Ownership History
Date
Name
Owned For
Owner Type
Purchase Details
Closed on
Mar 23, 2009
Sold by
Jpmorgan Chase Bank Na
Bought by
Torres Monica N
Current Estimated Value
Home Financials for this Owner
Home Financials are based on the most recent Mortgage that was taken out on this home.
Original Mortgage
$100,000
Interest Rate
5.13%
Mortgage Type
New Conventional
Purchase Details
Closed on
Oct 7, 2008
Sold by
Alvarenga Marta I
Bought by
Jpmorgan Chase Bank Na
Purchase Details
Closed on
Nov 14, 2005
Sold by
Osenga Darryl K and Osenga Dahra
Bought by
Alvarenga Marta I
Home Financials for this Owner
Home Financials are based on the most recent Mortgage that was taken out on this home.
Original Mortgage
$17,000
Interest Rate
5.9%
Mortgage Type
Unknown
Create a Home Valuation Report for This Property
The Home Valuation Report is an in-depth analysis detailing your home's value as well as a comparison with similar homes in the area
Home Values in the Area
Average Home Value in this Area
Purchase History
| Date | Buyer | Sale Price | Title Company |
|---|---|---|---|
| Torres Monica N | $135,000 | -- | |
| Jpmorgan Chase Bank Na | $149,372 | -- | |
| Alvarenga Marta I | $170,000 | -- |
Source: Public Records
Mortgage History
| Date | Status | Borrower | Loan Amount |
|---|---|---|---|
| Closed | Torres Monica N | $100,000 | |
| Previous Owner | Alvarenga Marta I | $17,000 | |
| Previous Owner | Alvarenga Marta I | $136,000 |
Source: Public Records
Tax History Compared to Growth
Tax History
| Year | Tax Paid | Tax Assessment Tax Assessment Total Assessment is a certain percentage of the fair market value that is determined by local assessors to be the total taxable value of land and additions on the property. | Land | Improvement |
|---|---|---|---|---|
| 2024 | -- | $136,640 | $21,120 | $115,520 |
| 2023 | $3,365 | $128,000 | $28,800 | $99,200 |
| 2022 | $0 | $111,520 | $20,000 | $91,520 |
| 2021 | $2,901 | $82,160 | $20,000 | $62,160 |
| 2020 | $2,919 | $82,160 | $20,000 | $62,160 |
| 2019 | $0 | $82,160 | $20,000 | $62,160 |
| 2018 | $2,735 | $77,880 | $16,400 | $61,480 |
| 2016 | $2,375 | $64,040 | $12,800 | $51,240 |
| 2015 | $2,313 | $61,680 | $11,200 | $50,480 |
| 2014 | $2,325 | $61,680 | $11,200 | $50,480 |
Source: Public Records
Map
Nearby Homes
- 1111 Pin Oak Dr
- 6001 Kingsbridge Rd Unit 3
- 1164 Red Oak Cove
- 4125 Spring Valley Cir Unit 7
- 1050 Wedgewood Ln
- 1066 Wedgewood Ln
- 6445 Wedgewood Trace Unit B
- 6414 Wedgewood Trace
- 533 Bentley Place
- 6420 Wedgeview Dr
- 434 Bentley Place
- 328 Bentley Place
- 1302 Branch Dr
- 1312 Branch Dr
- 225 Bentley Place
- 6393 Wedgeview Ct
- 1105 Chipwood Path
- 6686 Gunstock Ln
- 6716 Gunstock Ln
- 1106 Chipwood Path Unit 2
- 1056 Sanfords Walk
- 1095 Chipwood Path
- 1056 Sanford Walk
- 1056 Sanford's Walk NW
- 6676 Gunstock Ln
- 1076 Sanfords Walk
- 1046 Sanfords Walk Unit 2
- 6726 Gunstock Ln
- 1076 Sanford's Walk NW
- 1076 Sanford's Walk NW
- 1076 Sanford's Walk NW
- 6707 Gunstock Ln
- 6697 Gunstock Ln
- 6697 Gunstock Ln Unit 18
- 6697 Gunstock Ln Unit C
- 6717 Gunstock Ln