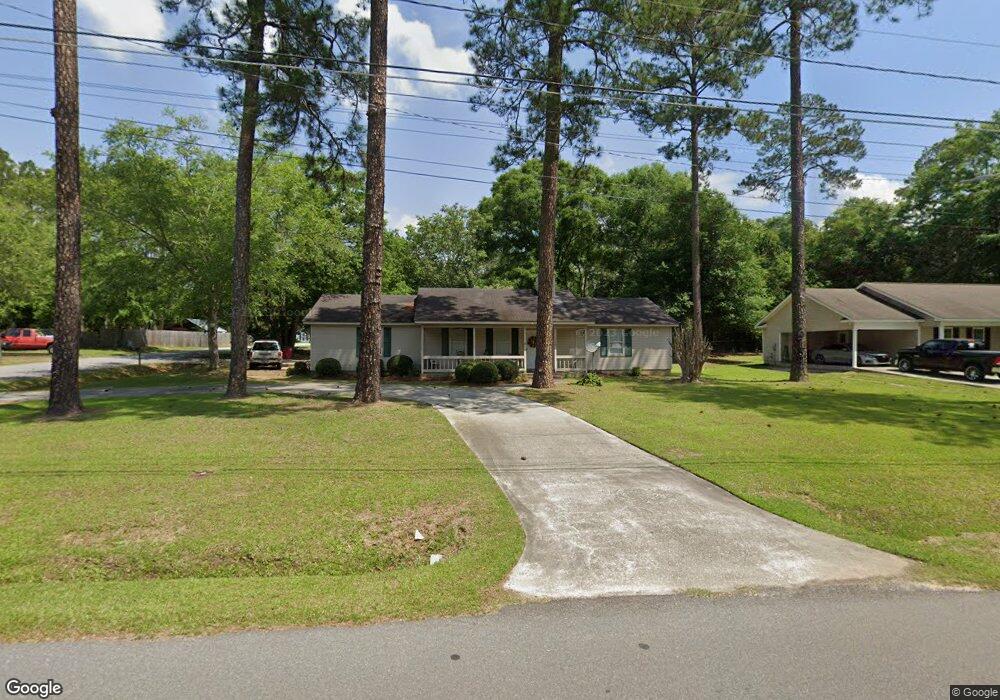
1115 Crescent Dr Tifton, GA 31794
Estimated Value: $170,000 - $201,000
3
Beds
2
Baths
1,612
Sq Ft
$115/Sq Ft
Est. Value
About This Home
This home is located at 1115 Crescent Dr, Tifton, GA 31794 and is currently estimated at $184,943, approximately $114 per square foot. 1115 Crescent Dr is a home located in Tift County with nearby schools including G.O. Bailey Elementary School, Charles Spencer Elementary School, and J.T. Reddick School.
Ownership History
Date
Name
Owned For
Owner Type
Purchase Details
Closed on
Jan 5, 2016
Sold by
Ross Timothy
Bought by
Ross Timothy and Ross Maurkya N
Current Estimated Value
Home Financials for this Owner
Home Financials are based on the most recent Mortgage that was taken out on this home.
Original Mortgage
$79,177
Outstanding Balance
$62,844
Interest Rate
3.98%
Mortgage Type
New Conventional
Estimated Equity
$122,099
Purchase Details
Closed on
Dec 18, 2015
Sold by
Rankin Shine
Bought by
Ross Timothy
Home Financials for this Owner
Home Financials are based on the most recent Mortgage that was taken out on this home.
Original Mortgage
$79,177
Outstanding Balance
$62,844
Interest Rate
3.98%
Mortgage Type
New Conventional
Estimated Equity
$122,099
Purchase Details
Closed on
Sep 27, 1995
Sold by
Brown James D
Bought by
Rankin Shine and Rankin Florence R
Purchase Details
Closed on
Jul 18, 1991
Sold by
Tifton Bank And Trust Company
Bought by
Brown James D
Purchase Details
Closed on
Mar 26, 1991
Sold by
Homes By Cox Corporation
Bought by
Tifton Bank And Trust Company
Create a Home Valuation Report for This Property
The Home Valuation Report is an in-depth analysis detailing your home's value as well as a comparison with similar homes in the area
Home Values in the Area
Average Home Value in this Area
Purchase History
| Date | Buyer | Sale Price | Title Company |
|---|---|---|---|
| Ross Timothy | -- | -- | |
| Ross Timothy | $77,000 | -- | |
| Rankin Shine | $65,000 | -- | |
| Brown James D | $59,000 | -- | |
| Tifton Bank And Trust Company | -- | -- |
Source: Public Records
Mortgage History
| Date | Status | Borrower | Loan Amount |
|---|---|---|---|
| Open | Ross Timothy | $79,177 |
Source: Public Records
Tax History Compared to Growth
Tax History
| Year | Tax Paid | Tax Assessment Tax Assessment Total Assessment is a certain percentage of the fair market value that is determined by local assessors to be the total taxable value of land and additions on the property. | Land | Improvement |
|---|---|---|---|---|
| 2024 | $1,642 | $64,765 | $6,000 | $58,765 |
| 2023 | $1,749 | $32,845 | $3,960 | $28,885 |
| 2022 | $1,087 | $32,845 | $3,960 | $28,885 |
| 2021 | $1,093 | $32,845 | $3,960 | $28,885 |
| 2020 | $1,120 | $32,845 | $3,960 | $28,885 |
| 2019 | $1,120 | $32,845 | $3,960 | $28,885 |
| 2018 | $1,120 | $32,845 | $3,960 | $28,885 |
| 2017 | $1,151 | $32,845 | $3,960 | $28,885 |
| 2016 | $1,071 | $32,845 | $3,960 | $28,885 |
| 2015 | $1,154 | $32,845 | $3,960 | $28,885 |
| 2014 | $1,156 | $32,845 | $3,960 | $28,885 |
| 2013 | -- | $32,844 | $3,960 | $28,884 |
Source: Public Records
Map
Nearby Homes
- 1137 Oquinn Dr
- 1430 Madison Ave
- 219 Cypress Ridge Rd
- 536 Osprey Cir
- 33 Oquinn Rd
- 515 Osprey Cir
- 566 Osprey Cir
- 0 Old Ocilla Rd Unit 138781
- 0 Old Ocilla Rd Unit 10611000
- 0 Ferry Lake Rd
- 801 12th St E
- 1809 Davis Ave
- -0- Old Ocilla Rd
- 705 20th St E
- 1601 Wanda Way
- 1003 Davis Ave
- 2014 Davis Ave
- 2021 Davis Ave
- 0 44th & 46th St Lots Unit 138029
- 2020 Davis Ave
- 1119 Crescent Dr
- 1483 Olde Creek Rd
- 1113 Crescent Dr
- 1125 Crescent Dr
- 1487 Olde Creek Rd
- 1114 Crescent Dr
- 1486 Olde Tram Rd
- 1315 Tiffany Dr
- 1105 Crescent Dr
- 1488 Olde Tram Rd
- 1112 Crescent Dr
- 1489 Olde Creek Rd
- 1486 Olde Creek Rd
- 1474 Twila Dr
- 1133 Crescent Dr
- 1476 Twila Dr
- 1485 Olde Tram Rd
- 1309 Tiffany Dr
- 1134 Crescent Dr
- 1478 Twila Dr