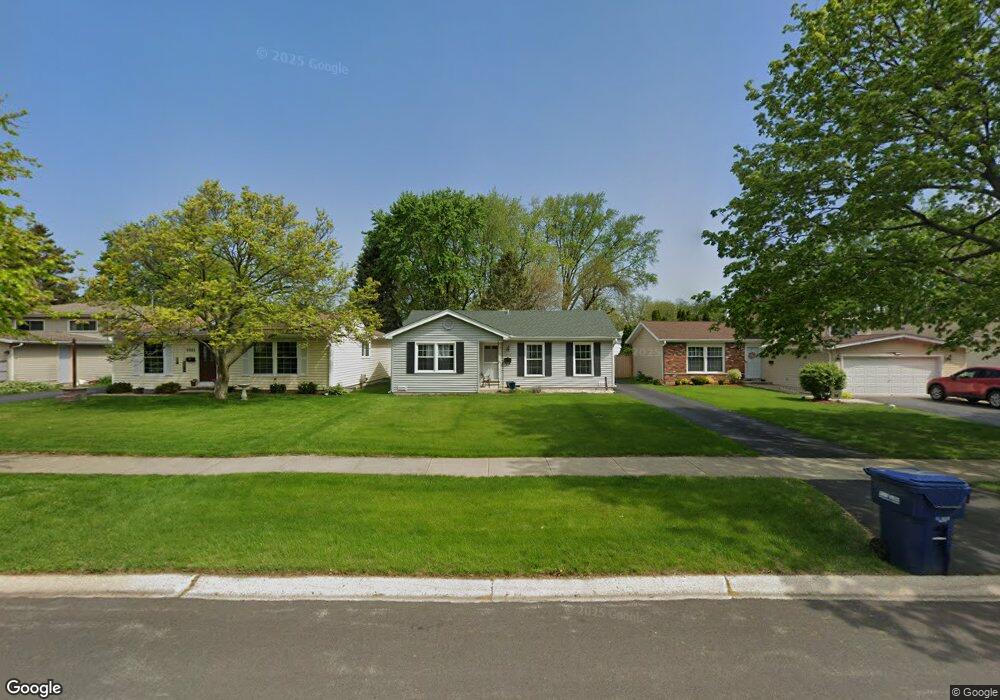
1115 Dawes Ave Wheaton, IL 60189
Southeast Wheaton NeighborhoodEstimated Value: $357,502 - $412,000
3
Beds
1
Bath
1,102
Sq Ft
$347/Sq Ft
Est. Value
About This Home
This home is located at 1115 Dawes Ave, Wheaton, IL 60189 and is currently estimated at $382,876, approximately $347 per square foot. 1115 Dawes Ave is a home located in DuPage County with nearby schools including Lincoln Elementary School, Haines Elementary School, and Nelson Prairie School.
Ownership History
Date
Name
Owned For
Owner Type
Purchase Details
Closed on
Aug 31, 2017
Sold by
Domark Steven M and Domark Tammy Y
Bought by
Badrina Roque
Current Estimated Value
Home Financials for this Owner
Home Financials are based on the most recent Mortgage that was taken out on this home.
Original Mortgage
$209,000
Outstanding Balance
$174,530
Interest Rate
3.9%
Mortgage Type
New Conventional
Estimated Equity
$208,346
Purchase Details
Closed on
Jan 25, 2002
Sold by
Domark Steven M
Bought by
Domark Tammy Y
Purchase Details
Closed on
Feb 15, 1995
Sold by
Wunderlich Daniel and Anderson Marie
Bought by
Domark Steven M
Home Financials for this Owner
Home Financials are based on the most recent Mortgage that was taken out on this home.
Original Mortgage
$90,400
Interest Rate
9.26%
Create a Home Valuation Report for This Property
The Home Valuation Report is an in-depth analysis detailing your home's value as well as a comparison with similar homes in the area
Home Values in the Area
Average Home Value in this Area
Purchase History
| Date | Buyer | Sale Price | Title Company |
|---|---|---|---|
| Badrina Roque | $220,000 | Precision Title | |
| Domark Tammy Y | -- | -- | |
| Domark Steven M | $113,000 | -- |
Source: Public Records
Mortgage History
| Date | Status | Borrower | Loan Amount |
|---|---|---|---|
| Open | Badrina Roque | $209,000 | |
| Previous Owner | Domark Steven M | $90,400 |
Source: Public Records
Tax History Compared to Growth
Tax History
| Year | Tax Paid | Tax Assessment Tax Assessment Total Assessment is a certain percentage of the fair market value that is determined by local assessors to be the total taxable value of land and additions on the property. | Land | Improvement |
|---|---|---|---|---|
| 2024 | $5,340 | $90,855 | $36,970 | $53,885 |
| 2023 | $5,111 | $83,630 | $34,030 | $49,600 |
| 2022 | $5,058 | $79,030 | $32,160 | $46,870 |
| 2021 | $5,036 | $77,160 | $31,400 | $45,760 |
| 2020 | $5,019 | $76,440 | $31,110 | $45,330 |
| 2019 | $4,898 | $74,420 | $30,290 | $44,130 |
| 2018 | $4,633 | $69,970 | $28,540 | $41,430 |
| 2017 | $4,556 | $67,390 | $27,490 | $39,900 |
| 2016 | $4,487 | $64,700 | $26,390 | $38,310 |
| 2015 | $4,442 | $61,730 | $25,180 | $36,550 |
| 2014 | $4,151 | $57,200 | $16,910 | $40,290 |
| 2013 | $4,045 | $57,370 | $16,960 | $40,410 |
Source: Public Records
Map
Nearby Homes
- 1244 Loughborough Ct
- 1316 Wilson Ave
- 1038 Liskeard Ct
- 1407 Wilson Ave
- 1026 Briarcliffe Blvd
- 1240 S Lorraine Rd Unit 2B
- 1000 S Lorraine Rd Unit 412
- 1000 S Lorraine Rd Unit 315
- 1000 S Lorraine Rd Unit 214
- 1581 Groton Ln
- 1129 Rhodes Ct
- 850 S Lorraine Rd Unit 1G
- 850 S Lorraine Rd Unit 3L
- 512 Pershing Ave
- 215 Orchard Ln
- 722 E Indiana St
- 1631 Southampton Ct
- 1010 Heathrow Ct
- 220 E Elm St
- 1547 Huntleigh Dr
- 1111 Dawes Ave
- 1119 Dawes Ave
- 1107 Dawes Ave
- 1220 S Williston St
- 1114 Coolidge Ave
- 1118 Coolidge Ave
- 1108 Coolidge Ave
- 1106 Coolidge Ave
- 1023 Dawes Ave
- 1102 Coolidge Ave
- 1219 S Williston St
- 1108 Dawes Ave
- 1116 Dawes Ave
- 1019 Dawes Ave
- 1304 S Williston St
- 1020 Coolidge Ave
- 1106 Dawes Ave
- 1102 Dawes Ave
- 1203 S Williston St
- 1018 Coolidge Ave