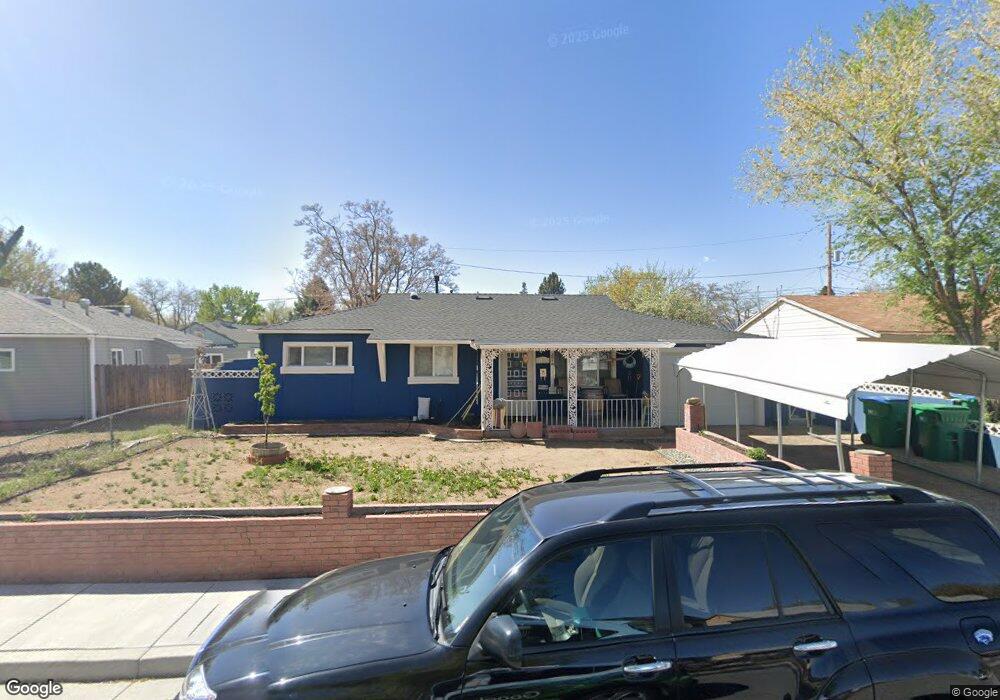
1115 Dodson Way Sparks, NV 89431
North Rock NeighborhoodEstimated Value: $423,000 - $478,000
4
Beds
2
Baths
1,764
Sq Ft
$256/Sq Ft
Est. Value
About This Home
This home is located at 1115 Dodson Way, Sparks, NV 89431 and is currently estimated at $451,506, approximately $255 per square foot. 1115 Dodson Way is a home located in Washoe County with nearby schools including Alice Maxwell Elementary School, Sparks Middle School, and Sparks High School.
Ownership History
Date
Name
Owned For
Owner Type
Purchase Details
Closed on
Jan 23, 2002
Sold by
Dickerson Samuel C and Dickerson Marcie Marie
Bought by
Reyes David and Reyes Maria Cecilia
Current Estimated Value
Home Financials for this Owner
Home Financials are based on the most recent Mortgage that was taken out on this home.
Original Mortgage
$142,759
Outstanding Balance
$58,877
Interest Rate
7.17%
Mortgage Type
FHA
Estimated Equity
$392,629
Purchase Details
Closed on
Jan 15, 1999
Sold by
Dickerson Samuel C and Scott Marcie Marie
Bought by
Dickerson Samuel C and Dickerson Marcie Marie
Home Financials for this Owner
Home Financials are based on the most recent Mortgage that was taken out on this home.
Original Mortgage
$108,969
Interest Rate
6.63%
Mortgage Type
FHA
Purchase Details
Closed on
Oct 30, 1995
Sold by
Morrow Susan R
Bought by
Dickerson Samuel C and Scott Marcie Marie
Home Financials for this Owner
Home Financials are based on the most recent Mortgage that was taken out on this home.
Original Mortgage
$110,021
Interest Rate
7.59%
Mortgage Type
FHA
Create a Home Valuation Report for This Property
The Home Valuation Report is an in-depth analysis detailing your home's value as well as a comparison with similar homes in the area
Home Values in the Area
Average Home Value in this Area
Purchase History
| Date | Buyer | Sale Price | Title Company |
|---|---|---|---|
| Reyes David | $148,000 | Western Title Inc | |
| Dickerson Samuel C | -- | United Title | |
| Dickerson Samuel C | $112,000 | Comstock Title Company |
Source: Public Records
Mortgage History
| Date | Status | Borrower | Loan Amount |
|---|---|---|---|
| Open | Reyes David | $142,759 | |
| Previous Owner | Dickerson Samuel C | $108,969 | |
| Previous Owner | Dickerson Samuel C | $110,021 |
Source: Public Records
Tax History Compared to Growth
Tax History
| Year | Tax Paid | Tax Assessment Tax Assessment Total Assessment is a certain percentage of the fair market value that is determined by local assessors to be the total taxable value of land and additions on the property. | Land | Improvement |
|---|---|---|---|---|
| 2025 | $1,027 | $56,113 | $31,325 | $24,788 |
| 2024 | $1,027 | $54,592 | $30,100 | $24,492 |
| 2023 | $998 | $52,468 | $29,890 | $22,578 |
| 2022 | $970 | $43,467 | $25,095 | $18,372 |
| 2021 | $942 | $34,718 | $16,765 | $17,953 |
| 2020 | $912 | $33,975 | $16,345 | $17,630 |
| 2019 | $886 | $32,578 | $15,890 | $16,688 |
| 2018 | $860 | $27,238 | $11,235 | $16,003 |
| 2017 | $835 | $25,870 | $10,150 | $15,720 |
| 2016 | $814 | $24,742 | $8,225 | $16,517 |
| 2015 | $813 | $24,196 | $7,140 | $17,056 |
| 2014 | $789 | $23,290 | $6,440 | $16,850 |
| 2013 | -- | $21,083 | $3,955 | $17,128 |
Source: Public Records
Map
Nearby Homes
- 1125 Dodson Way
- 1160 York Way
- 1345 Plymouth Way
- 1110 Xman Way
- 0 N Mccarran Blvd Unit 250052909
- 3269 Valley Forge Way
- 3252 Holman Way
- 1620 Gault Way
- 1595 York Way
- 2154 Oppio St
- 1124 Sbragia Way
- 1731 Gault Way Unit D
- 780 Emerson Way
- 1003 Sbragia Way
- 1705 9th St
- 1655 Byrd Dr
- 465 Lenwood Dr
- 5530 High Rock Way
- 1121 Greenbrae Dr
- 1799 Vance Way
- 1110 Plymouth Way
- 1120 Plymouth Way
- 2639 11th St
- 1110 Dodson Way
- 1140 Plymouth Way
- 1120 Dodson Way
- 2739 11th St
- 1165 Dodson Way
- 1140 Dodson Way
- 2680 11th St
- 2670 11th St
- 1160 Plymouth Way
- 2690 11th St
- 2640 11th St
- 2700 11th St
- 1115 Plymouth Way
- 1160 Dodson Way
- 1185 Dodson Way
- 2600 11th St
- 1125 Plymouth Way