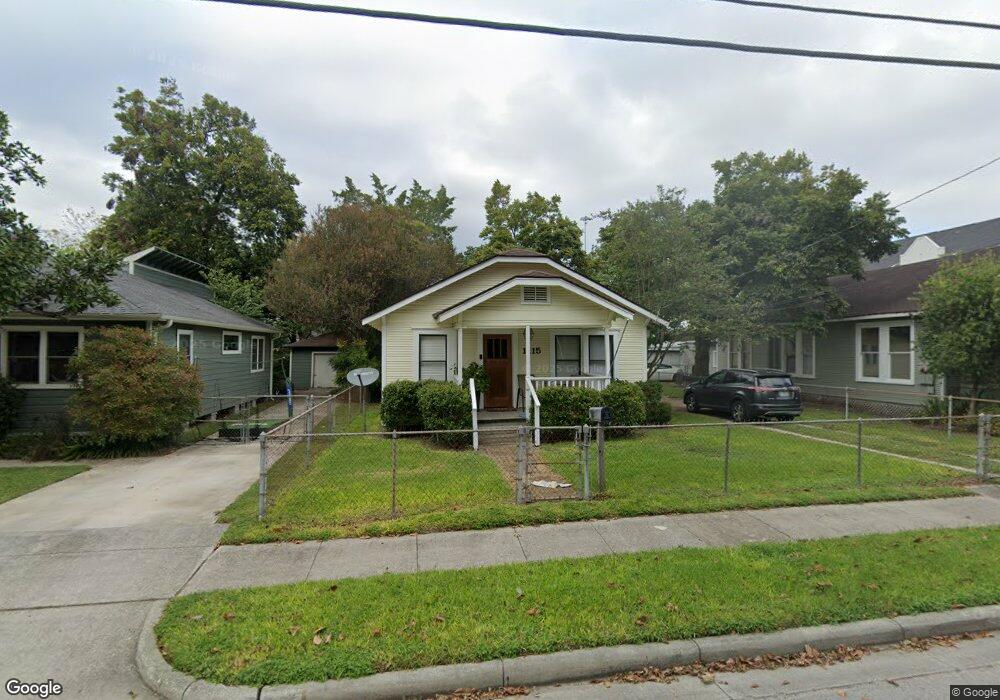
1115 E 28th St Houston, TX 77009
Greater Heights NeighborhoodEstimated Value: $500,000 - $813,264
2
Beds
1
Bath
1,200
Sq Ft
$572/Sq Ft
Est. Value
About This Home
This home is located at 1115 E 28th St, Houston, TX 77009 and is currently estimated at $686,088, approximately $571 per square foot. 1115 E 28th St is a home located in Harris County with nearby schools including Field Elementary School, Hamilton Middle, and Heights High School.
Ownership History
Date
Name
Owned For
Owner Type
Purchase Details
Closed on
Dec 11, 2023
Sold by
Brown Roger L and Brown Nancy M
Bought by
Left-Hand Daddies - 1115 E 28Th L L C
Current Estimated Value
Purchase Details
Closed on
Dec 12, 2022
Sold by
Left-Hand Daddies-1115 E 28Th Llc
Bought by
Brown Roger L and Brown Nancy M
Purchase Details
Closed on
Nov 16, 2016
Sold by
Brown Roger L and Brown Nancy M
Bought by
Brown Roger L and Brown Nancy M
Purchase Details
Closed on
Jan 12, 2015
Sold by
Left-Hand Daddies-1115 E 28Th Llc
Bought by
Brown Roger L and Brown Nancy M
Purchase Details
Closed on
Dec 31, 2013
Sold by
Brown Roger L and Brown Nancy M
Bought by
Left Hand Daddies 115 E 28Th Llc
Purchase Details
Closed on
Jul 31, 1998
Sold by
Mccallister Charles E and Mccallister Frances L
Bought by
Brown Roger L and Brown Nancy M
Home Financials for this Owner
Home Financials are based on the most recent Mortgage that was taken out on this home.
Original Mortgage
$82,500
Interest Rate
8.21%
Mortgage Type
Seller Take Back
Create a Home Valuation Report for This Property
The Home Valuation Report is an in-depth analysis detailing your home's value as well as a comparison with similar homes in the area
Home Values in the Area
Average Home Value in this Area
Purchase History
| Date | Buyer | Sale Price | Title Company |
|---|---|---|---|
| Left-Hand Daddies - 1115 E 28Th L L C | -- | None Listed On Document | |
| Brown Roger L | -- | -- | |
| Brown Roger L | -- | None Available | |
| Brown Roger L | -- | None Available | |
| Left Hand Daddies 115 E 28Th Llc | -- | None Available | |
| Brown Roger L | -- | -- |
Source: Public Records
Mortgage History
| Date | Status | Borrower | Loan Amount |
|---|---|---|---|
| Previous Owner | Brown Roger L | $82,500 |
Source: Public Records
Tax History
| Year | Tax Paid | Tax Assessment Tax Assessment Total Assessment is a certain percentage of the fair market value that is determined by local assessors to be the total taxable value of land and additions on the property. | Land | Improvement |
|---|---|---|---|---|
| 2025 | $16,665 | $815,000 | $750,000 | $65,000 |
| 2024 | $16,665 | $796,468 | $700,000 | $96,468 |
| 2023 | $16,665 | $792,000 | $700,000 | $92,000 |
| 2022 | $15,236 | $691,968 | $600,000 | $91,968 |
| 2021 | $13,123 | $563,077 | $480,000 | $83,077 |
| 2020 | $13,578 | $560,728 | $480,000 | $80,728 |
| 2019 | $13,288 | $525,114 | $480,000 | $45,114 |
| 2018 | $9,493 | $375,148 | $374,948 | $200 |
| 2017 | $9,486 | $375,148 | $304,100 | $71,048 |
| 2016 | $10,318 | $408,044 | $320,000 | $88,044 |
| 2015 | $7,455 | $408,044 | $320,000 | $88,044 |
| 2014 | $7,455 | $290,000 | $240,000 | $50,000 |
Source: Public Records
Map
Nearby Homes
- 1203 E 28th St
- 1113 E 27th St
- 1035 E 28th St
- 1222 E 28th St
- 1110 E 27th St
- 2618 Baylor St
- 1016 E 27th St
- 1001 E 27th St
- 1208 E 26th St Unit B
- 2806 Princeton St
- 2810 Princeton St
- 1307 E 27th St
- 1307 E 27th St Unit A
- 1327 & 1329 North Loop
- 2607 Link Rd
- 1003 E 28th St
- 1019 E 32nd St
- 917 North Loop
- 902 E 27th St
- 842 E 29th St
- 2817 Grinnell St
- 2821 Grinnell St
- 1130 E 29th St
- 1130 E 29th St Unit A
- 1117 E 28th St
- 1118 E 29th St
- 1111 E 28th St
- 2825 Grinnell St
- 1109 E 28th St
- 1114 E 29th St
- 1112 E 29th St
- 2808 Grinnell St
- 2812 Grinnell St
- 1107 E 28th St
- 2820 Grinnell St
- 1110 E 29th St
- 2816 Grinnell St
- 1202 E 29th St
- 1204 E 29th St
- 1204 E 29th St Unit SI ID1018984P
Your Personal Tour Guide
Ask me questions while you tour the home.