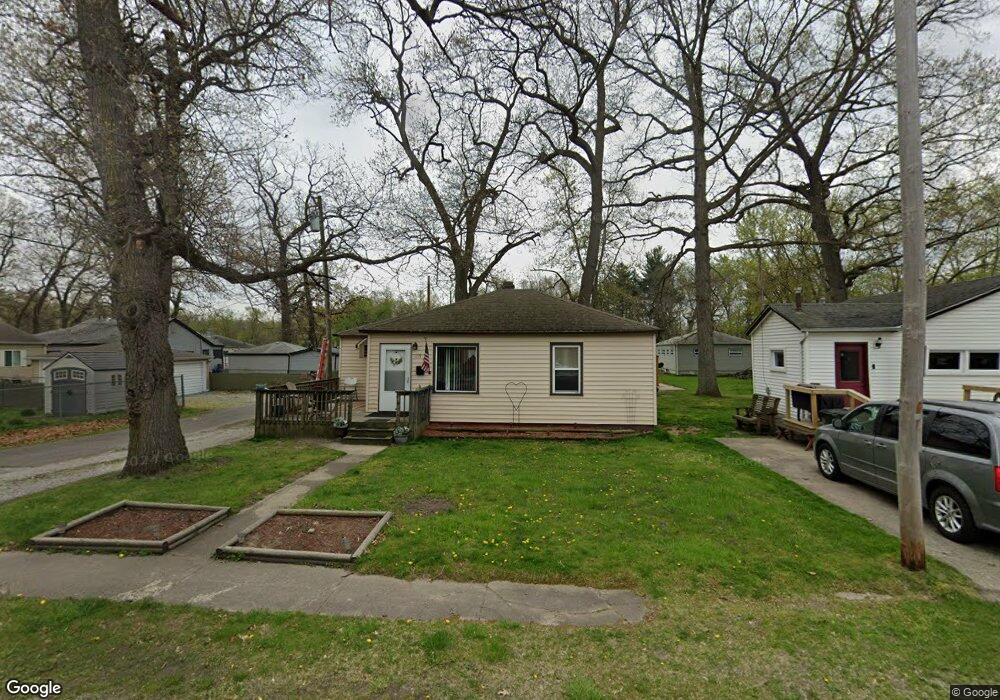
1115 E 5th St Hobart, IN 46342
Estimated Value: $118,000 - $161,000
2
Beds
1
Bath
768
Sq Ft
$178/Sq Ft
Est. Value
About This Home
This home is located at 1115 E 5th St, Hobart, IN 46342 and is currently estimated at $136,441, approximately $177 per square foot. 1115 E 5th St is a home located in Lake County with nearby schools including Hobart High School, Trinity Lutheran School, and Hobart Baptist School.
Ownership History
Date
Name
Owned For
Owner Type
Purchase Details
Closed on
Apr 12, 2006
Sold by
Wm Specialty Mortgage Llc
Bought by
Gallagher William M
Current Estimated Value
Home Financials for this Owner
Home Financials are based on the most recent Mortgage that was taken out on this home.
Original Mortgage
$52,200
Outstanding Balance
$30,101
Interest Rate
6.42%
Mortgage Type
Fannie Mae Freddie Mac
Estimated Equity
$106,340
Purchase Details
Closed on
Dec 2, 2005
Sold by
Beneze Joshua A and Ameriquest Mortgage Co
Bought by
Wm Specialty Mortgage Llc
Create a Home Valuation Report for This Property
The Home Valuation Report is an in-depth analysis detailing your home's value as well as a comparison with similar homes in the area
Home Values in the Area
Average Home Value in this Area
Purchase History
| Date | Buyer | Sale Price | Title Company |
|---|---|---|---|
| Gallagher William M | -- | Meridian Title Corp | |
| Wm Specialty Mortgage Llc | $73,106 | None Available |
Source: Public Records
Mortgage History
| Date | Status | Borrower | Loan Amount |
|---|---|---|---|
| Open | Gallagher William M | $52,200 |
Source: Public Records
Tax History Compared to Growth
Tax History
| Year | Tax Paid | Tax Assessment Tax Assessment Total Assessment is a certain percentage of the fair market value that is determined by local assessors to be the total taxable value of land and additions on the property. | Land | Improvement |
|---|---|---|---|---|
| 2024 | $3,376 | $87,200 | $12,900 | $74,300 |
| 2023 | $1,862 | $82,700 | $12,900 | $69,800 |
| 2022 | $1,862 | $77,100 | $12,900 | $64,200 |
| 2021 | $1,622 | $66,400 | $8,600 | $57,800 |
| 2020 | $1,644 | $67,600 | $8,600 | $59,000 |
| 2019 | $1,775 | $64,400 | $8,600 | $55,800 |
| 2018 | $1,843 | $62,000 | $8,600 | $53,400 |
| 2017 | $1,728 | $57,100 | $8,600 | $48,500 |
| 2016 | $1,645 | $55,500 | $8,600 | $46,900 |
| 2014 | $1,757 | $59,700 | $8,600 | $51,100 |
| 2013 | $1,819 | $61,700 | $8,600 | $53,100 |
Source: Public Records
Map
Nearby Homes