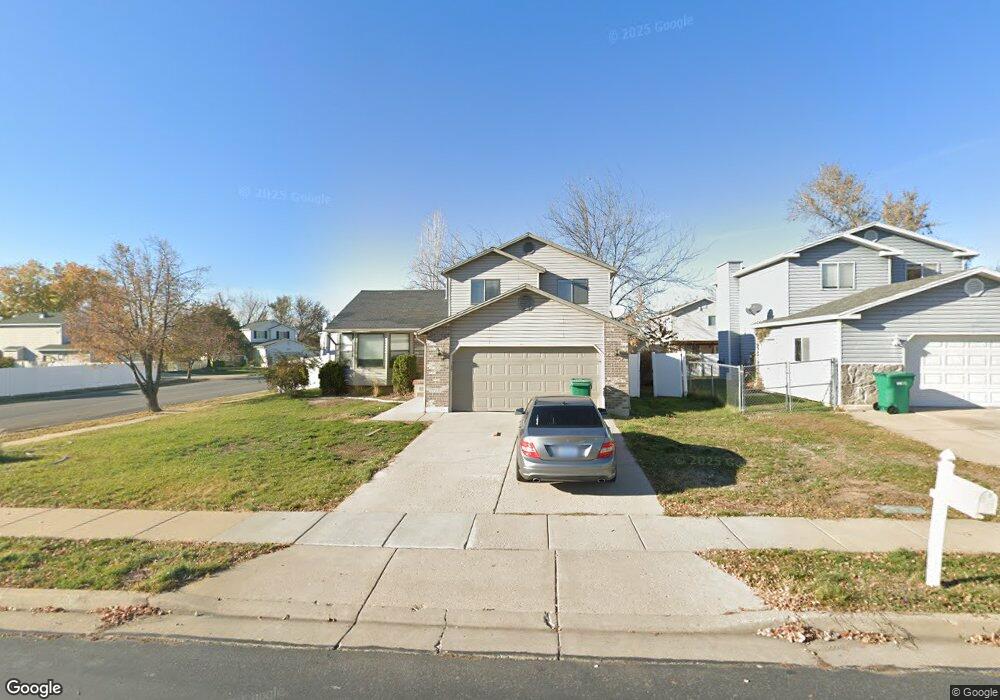
1115 E 750 S Layton, UT 84041
Estimated Value: $488,400 - $513,000
3
Beds
3
Baths
2,309
Sq Ft
$217/Sq Ft
Est. Value
About This Home
This home is located at 1115 E 750 S, Layton, UT 84041 and is currently estimated at $501,350, approximately $217 per square foot. 1115 E 750 S is a home located in Davis County with nearby schools including Creekside Elementary School, Fairfield Junior High School, and Davis High School.
Ownership History
Date
Name
Owned For
Owner Type
Purchase Details
Closed on
Oct 4, 2022
Sold by
Memmott Anna
Bought by
Darius Val
Current Estimated Value
Purchase Details
Closed on
Mar 10, 2016
Sold by
Memmott Leiws Mccord
Bought by
Memmott Anna
Purchase Details
Closed on
Jun 20, 2014
Sold by
Taufer Steven L and Taufer Fleur
Bought by
Memmott Lewis Mccord
Purchase Details
Closed on
Jun 5, 2003
Sold by
Thompson Michael B and Thompson Teri
Bought by
Taufer Steven L and Taufer Fleur
Home Financials for this Owner
Home Financials are based on the most recent Mortgage that was taken out on this home.
Original Mortgage
$157,528
Interest Rate
5.71%
Mortgage Type
FHA
Purchase Details
Closed on
Jan 31, 2003
Sold by
Chappell Clint and Chappell Keri C
Bought by
Thompson Michael B and Thompson Teri
Create a Home Valuation Report for This Property
The Home Valuation Report is an in-depth analysis detailing your home's value as well as a comparison with similar homes in the area
Home Values in the Area
Average Home Value in this Area
Purchase History
| Date | Buyer | Sale Price | Title Company |
|---|---|---|---|
| Darius Val | -- | -- | |
| Memmott Anna | -- | Founders Title | |
| Memmott Lewis Mccord | -- | Mountain View Title | |
| Taufer Steven L | -- | Equity Title Agency | |
| Thompson Michael B | -- | Millcreek Land Title Insuran |
Source: Public Records
Mortgage History
| Date | Status | Borrower | Loan Amount |
|---|---|---|---|
| Previous Owner | Taufer Steven L | $157,528 |
Source: Public Records
Tax History
| Year | Tax Paid | Tax Assessment Tax Assessment Total Assessment is a certain percentage of the fair market value that is determined by local assessors to be the total taxable value of land and additions on the property. | Land | Improvement |
|---|---|---|---|---|
| 2025 | $2,201 | $231,000 | $89,956 | $141,044 |
| 2024 | $2,101 | $222,199 | $105,220 | $116,979 |
| 2023 | $2,092 | $214,500 | $70,892 | $143,607 |
| 2022 | $2,190 | $403,000 | $121,832 | $281,168 |
| 2021 | $2,060 | $311,000 | $91,044 | $219,956 |
| 2020 | $1,864 | $270,000 | $77,838 | $192,162 |
| 2019 | $1,826 | $259,000 | $75,066 | $183,934 |
| 2018 | $1,657 | $236,000 | $75,066 | $160,934 |
| 2016 | $1,529 | $112,310 | $23,181 | $89,129 |
| 2015 | $1,470 | $102,520 | $23,181 | $79,339 |
| 2014 | $1,464 | $104,398 | $23,181 | $81,217 |
| 2013 | -- | $94,122 | $21,913 | $72,209 |
Source: Public Records
Map
Nearby Homes
- 772 N Crimson Ln
- 766 N Stonne Ln
- 679 S Clearwater Falls Dr
- 680 N Main St Trlr E-11
- 524 Hyde Park Ln
- 1368 E 275 S
- 895 S Main St Unit E
- 1137 Holmes Creek Ln
- 680 N Main St Unit B13
- 680 N Main St Unit D14
- 917 S Main St Unit H
- 905 S Main St Unit G
- 623 E Clearwater Dr Unit 15
- 706 S 600 E
- 811 S Main St
- 617 E 405 S
- 1328 E Orchard Ridge Ln
- 420 N Main St Unit 22
- 150 E 600 N Unit 5
- 150 E 600 N Unit 18
- 1115 Meadow Way Dr
- 1119 E 750 S
- 1119 Meadow Way Dr
- 705 S Pheasant View Dr
- 956 S Pheasant View Dr
- 1123 Meadow Way Dr
- 1093 E Meadow Way Dr
- 681 S Pheasant View Dr
- 1093 E 750 S
- 1093 Meadow Way Dr
- 1127 Meadow Way Dr
- 1112 Meadow Way Dr
- 1116 Meadow Way Dr
- 1120 Meadow Way Dr
- 1108 E Meadow Way Dr
- 677 S Pheasant View Dr
- 1081 Meadow Way Dr
- 1081 E 750 S
- 1124 E 750 S
- 1124 Meadow Way Dr
Your Personal Tour Guide
Ask me questions while you tour the home.