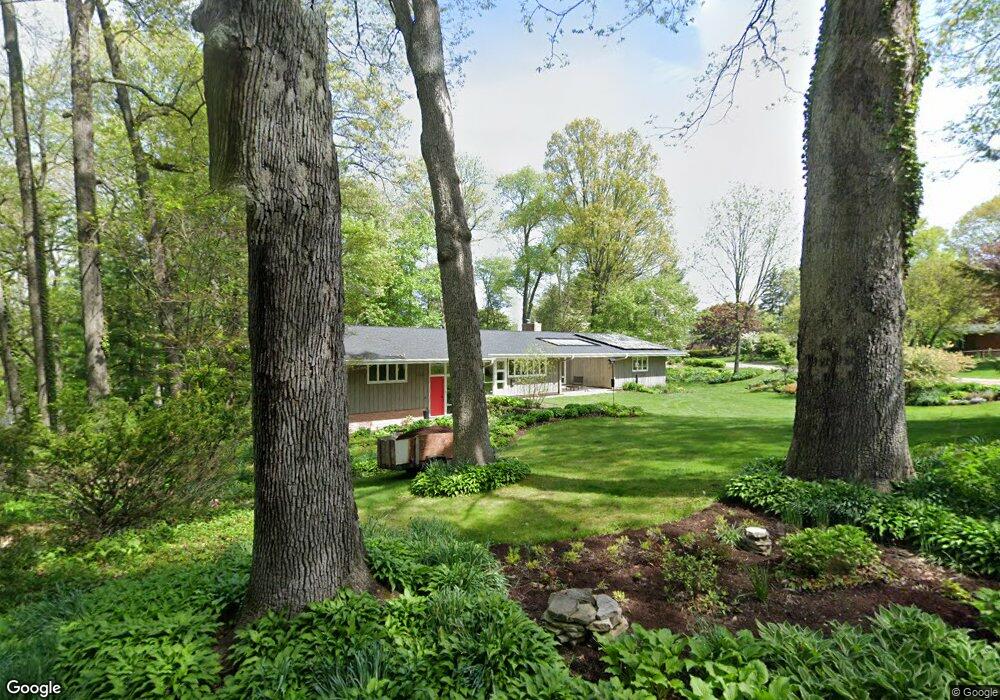
1115 E Chestnut St Mount Vernon, OH 43050
Estimated Value: $331,000 - $487,000
4
Beds
4
Baths
3,319
Sq Ft
$126/Sq Ft
Est. Value
About This Home
This home is located at 1115 E Chestnut St, Mount Vernon, OH 43050 and is currently estimated at $417,089, approximately $125 per square foot. 1115 E Chestnut St is a home located in Knox County with nearby schools including Mount Vernon High School, St. Vincent de Paul School, and Mount Vernon Sda Elementary School.
Ownership History
Date
Name
Owned For
Owner Type
Purchase Details
Closed on
Aug 26, 2005
Sold by
Langfitt Thomas Paul and Langfitt Martha J
Bought by
Hofferberth John E and Hofferberth Kristin M
Current Estimated Value
Home Financials for this Owner
Home Financials are based on the most recent Mortgage that was taken out on this home.
Original Mortgage
$216,700
Interest Rate
5.8%
Mortgage Type
Purchase Money Mortgage
Purchase Details
Closed on
May 23, 2002
Bought by
Langfitt Thomas Paul and Langfitt Ma
Purchase Details
Closed on
Nov 8, 1994
Sold by
Smythe Regina M
Bought by
Smythe Richard L Trustee
Create a Home Valuation Report for This Property
The Home Valuation Report is an in-depth analysis detailing your home's value as well as a comparison with similar homes in the area
Home Values in the Area
Average Home Value in this Area
Purchase History
| Date | Buyer | Sale Price | Title Company |
|---|---|---|---|
| Hofferberth John E | $191,250 | None Available | |
| Langfitt Thomas Paul | $220,000 | -- | |
| Smythe Richard L Trustee | -- | -- |
Source: Public Records
Mortgage History
| Date | Status | Borrower | Loan Amount |
|---|---|---|---|
| Previous Owner | Hofferberth John E | $216,700 |
Source: Public Records
Tax History
| Year | Tax Paid | Tax Assessment Tax Assessment Total Assessment is a certain percentage of the fair market value that is determined by local assessors to be the total taxable value of land and additions on the property. | Land | Improvement |
|---|---|---|---|---|
| 2024 | $3,944 | $104,590 | $4,080 | $100,510 |
| 2023 | $4,032 | $104,590 | $4,080 | $100,510 |
| 2022 | $3,355 | $79,240 | $3,090 | $76,150 |
| 2021 | $3,355 | $79,240 | $3,090 | $76,150 |
| 2020 | $3,268 | $79,240 | $3,090 | $76,150 |
| 2019 | $3,359 | $75,930 | $3,340 | $72,590 |
| 2018 | $3,359 | $75,930 | $3,340 | $72,590 |
| 2017 | $3,299 | $75,930 | $3,340 | $72,590 |
| 2016 | $3,060 | $70,310 | $3,090 | $67,220 |
| 2015 | $3,073 | $70,310 | $3,090 | $67,220 |
| 2014 | $3,089 | $70,310 | $3,090 | $67,220 |
| 2013 | $3,355 | $72,830 | $2,910 | $69,920 |
Source: Public Records
Map
Nearby Homes
- 6 Edgewood Blvd
- 1107 Oak Street Extension
- 11 Highland Dr
- 802 Coshocton Ave
- 17900 New Gambier Rd
- 200 Eastwood Dr
- 501 Oak St
- 203 S Center St
- 14 Hilltop Dr
- 900 E Gambier St
- 4 Craig Dr
- 18 Woodlake Trail
- 0 Miami St
- 600 1/2 E Chestnut St
- 600 E Chestnut St Unit 1/2
- 2 Coventry Ct
- 418 E Pleasant St
- 213 Coshocton Ave
- 655 Howard St
- 649 Howard St
- 102 Stevens St
- 1111 E Chestnut St
- 104 Stevens St
- 1200 E Chestnut St
- 1202 E Chestnut St
- 106 Stevens St
- 101 Vernedale Dr
- 103 Vernedale Dr
- 1015 E High St
- 304 Hillcrest Dr
- 1106 E Chestnut St
- 1204 E Chestnut St
- 108 Stevens St
- 105 Vernedale Dr
- 1105 E Chestnut St
- 1013 E High St E
- 402 Hillcrest Dr
- 1 Stevens St
- 1206 E Chestnut St
- 302 Hillcrest Dr
Your Personal Tour Guide
Ask me questions while you tour the home.