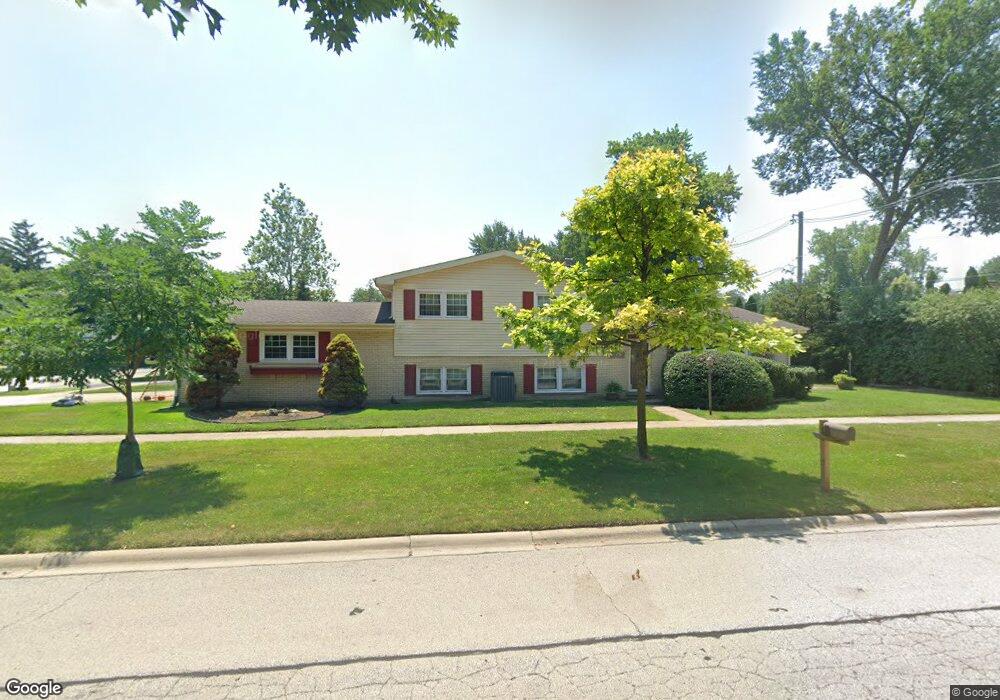
1115 E Fairview St Arlington Heights, IL 60005
Estimated Value: $459,801 - $575,000
3
Beds
2
Baths
1,316
Sq Ft
$391/Sq Ft
Est. Value
About This Home
This home is located at 1115 E Fairview St, Arlington Heights, IL 60005 and is currently estimated at $515,200, approximately $391 per square foot. 1115 E Fairview St is a home located in Cook County with nearby schools including Dryden Elementary School, South Middle School, and Prospect High School.
Ownership History
Date
Name
Owned For
Owner Type
Purchase Details
Closed on
Oct 30, 2014
Sold by
Baker Jarred J and Baker Licia A
Bought by
Baker Jarred J and Baker Licia A
Current Estimated Value
Home Financials for this Owner
Home Financials are based on the most recent Mortgage that was taken out on this home.
Original Mortgage
$161,000
Interest Rate
4%
Mortgage Type
New Conventional
Purchase Details
Closed on
Oct 13, 2014
Sold by
Baker Jarred J
Bought by
Baker Jarred J
Home Financials for this Owner
Home Financials are based on the most recent Mortgage that was taken out on this home.
Original Mortgage
$161,000
Interest Rate
4%
Mortgage Type
New Conventional
Purchase Details
Closed on
Jul 22, 2013
Sold by
Baker Louise
Bought by
Baker Louise H and Louise H Baker Declaration Of Trust
Create a Home Valuation Report for This Property
The Home Valuation Report is an in-depth analysis detailing your home's value as well as a comparison with similar homes in the area
Purchase History
| Date | Buyer | Sale Price | Title Company |
|---|---|---|---|
| Baker Jarred J | -- | Fidelity National Title | |
| Baker Jarred J | -- | Fidelity National Title | |
| Baker Jarred J | -- | Fidelity National Title | |
| Baker Louise H | -- | None Available |
Source: Public Records
Mortgage History
| Date | Status | Borrower | Loan Amount |
|---|---|---|---|
| Closed | Baker Jarred J | $161,000 |
Source: Public Records
Tax History
| Year | Tax Paid | Tax Assessment Tax Assessment Total Assessment is a certain percentage of the fair market value that is determined by local assessors to be the total taxable value of land and additions on the property. | Land | Improvement |
|---|---|---|---|---|
| 2025 | $8,487 | $42,000 | $6,910 | $35,090 |
| 2024 | $8,487 | $31,000 | $5,758 | $25,242 |
| 2023 | $8,173 | $31,000 | $5,758 | $25,242 |
| 2022 | $8,173 | $31,000 | $5,758 | $25,242 |
| 2021 | $8,889 | $29,529 | $3,598 | $25,931 |
| 2020 | $8,659 | $29,529 | $3,598 | $25,931 |
| 2019 | $8,614 | $32,810 | $3,598 | $29,212 |
| 2018 | $9,171 | $31,428 | $3,166 | $28,262 |
| 2017 | $9,064 | $31,428 | $3,166 | $28,262 |
| 2016 | $8,453 | $31,428 | $3,166 | $28,262 |
| 2015 | $7,735 | $26,198 | $2,735 | $23,463 |
| 2014 | $7,510 | $26,198 | $2,735 | $23,463 |
| 2013 | $7,321 | $26,198 | $2,735 | $23,463 |
Source: Public Records
Map
Nearby Homes
- 606 S Roosevelt Ave
- 525 S Cleveland Ave Unit 208
- 525 S Cleveland Ave Unit 104
- 1454 E Northwest Hwy
- 621 E Grove St
- 347 S Newbury Place
- 200 S Derbyshire Ln
- 111 S Brighton Place
- 1815 E Grove St
- 407 S Pine Ave
- 717 S Arlington Heights Rd
- 313 E George St
- 901 S Burton Place
- 606 S Arlington Heights Rd
- 824 E Wing St
- 813 E Hamlin Ln
- 101 N Lincoln Ln Unit 2A
- 215 E Orchard St
- 507 S Waterman Ave
- 326 E Central Rd
- 606 S Cleveland Ave
- 610 S Cleveland Ave
- 1116 E Fairview St
- 1105 E Fairview St
- 605 S Roosevelt Ave
- 614 S Cleveland Ave
- 609 S Roosevelt Ave
- 1106 E Fairview St
- 538 S Cleveland Ave
- 1205 E Fairview St
- 615 S Roosevelt Ave
- 1206 E Fairview St Unit 308
- 1206 E Fairview St Unit 106
- 1206 E Fairview St Unit 206
- 1206 E Fairview St Unit 107
- 1206 E Fairview St Unit 201
- 1206 E Fairview St Unit 303
- 1206 E Fairview St Unit 205
- 1206 E Fairview St Unit 204
- 1206 E Fairview St Unit 103
Your Personal Tour Guide
Ask me questions while you tour the home.