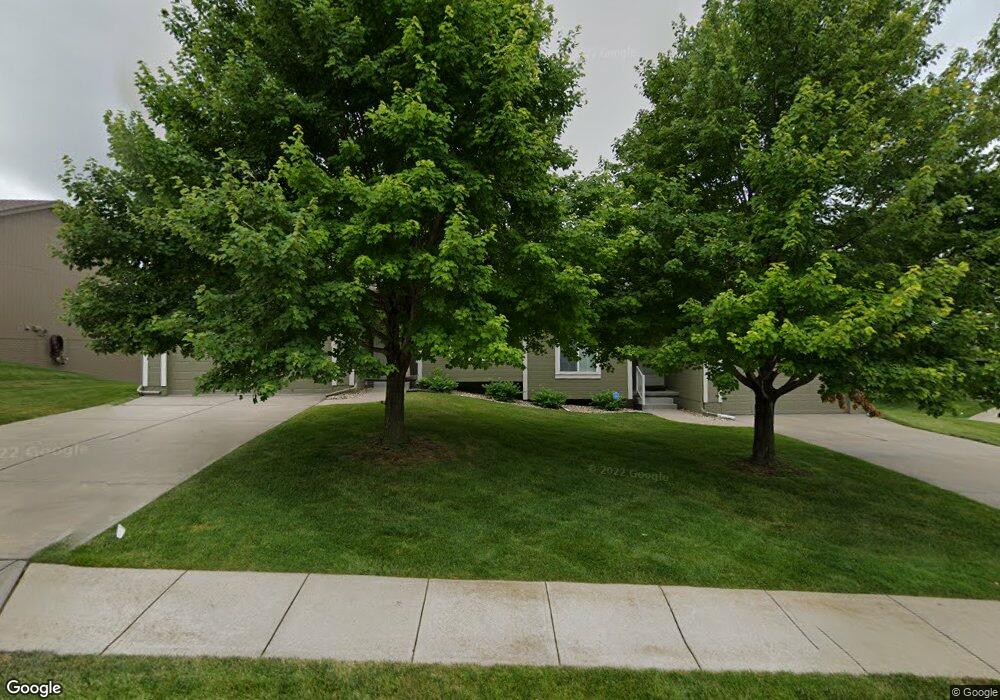
1115 Edward St Papillion, NE 68046
Estimated Value: $306,000 - $349,000
3
Beds
3
Baths
2,018
Sq Ft
$161/Sq Ft
Est. Value
About This Home
This home is located at 1115 Edward St, Papillion, NE 68046 and is currently estimated at $325,856, approximately $161 per square foot. 1115 Edward St is a home located in Sarpy County with nearby schools including Walnut Creek Elementary School, Papillion Middle School, and Papillion La Vista South High School.
Ownership History
Date
Name
Owned For
Owner Type
Purchase Details
Closed on
Dec 10, 2020
Sold by
Roehrig Kathy D
Bought by
Benjestorf Family Trust and Benjestorf
Current Estimated Value
Home Financials for this Owner
Home Financials are based on the most recent Mortgage that was taken out on this home.
Original Mortgage
$233,100
Outstanding Balance
$207,566
Interest Rate
2.71%
Mortgage Type
VA
Estimated Equity
$118,290
Purchase Details
Closed on
May 23, 2006
Sold by
Celebrity Townhomes Inc
Bought by
Roehrig Kathy D
Home Financials for this Owner
Home Financials are based on the most recent Mortgage that was taken out on this home.
Original Mortgage
$23,985
Interest Rate
6.56%
Mortgage Type
Stand Alone Second
Create a Home Valuation Report for This Property
The Home Valuation Report is an in-depth analysis detailing your home's value as well as a comparison with similar homes in the area
Home Values in the Area
Average Home Value in this Area
Purchase History
| Date | Buyer | Sale Price | Title Company |
|---|---|---|---|
| Benjestorf Family Trust | $225,000 | Midwest Title | |
| Roehrig Kathy D | $160,000 | Slt |
Source: Public Records
Mortgage History
| Date | Status | Borrower | Loan Amount |
|---|---|---|---|
| Open | Benjestorf Family Trust | $233,100 | |
| Previous Owner | Roehrig Kathy D | $23,985 | |
| Previous Owner | Roehrig Kathy D | $127,920 |
Source: Public Records
Tax History Compared to Growth
Tax History
| Year | Tax Paid | Tax Assessment Tax Assessment Total Assessment is a certain percentage of the fair market value that is determined by local assessors to be the total taxable value of land and additions on the property. | Land | Improvement |
|---|---|---|---|---|
| 2025 | $4,082 | $290,392 | $45,000 | $245,392 |
| 2024 | $4,635 | $272,968 | $42,000 | $230,968 |
| 2023 | $4,635 | $246,132 | $37,000 | $209,132 |
| 2022 | $5,222 | $231,390 | $34,000 | $197,390 |
| 2021 | $4,859 | $211,742 | $31,000 | $180,742 |
| 2020 | $4,660 | $198,891 | $29,000 | $169,891 |
| 2019 | $4,493 | $192,842 | $28,000 | $164,842 |
| 2018 | $4,312 | $179,077 | $26,000 | $153,077 |
| 2017 | $4,269 | $176,646 | $26,000 | $150,646 |
| 2016 | $4,099 | $169,361 | $26,000 | $143,361 |
| 2015 | $4,022 | $161,383 | $26,000 | $135,383 |
| 2014 | $3,863 | $154,011 | $26,000 | $128,011 |
| 2012 | -- | $153,312 | $26,000 | $127,312 |
Source: Public Records
Map
Nearby Homes
- 1104 Gold Coast Rd
- 1004 Berkley Ave
- 1125 Rawhide Rd
- 1704 Southview Dr
- 1806 Walnut Creek Dr
- 1203 Rawhide Rd
- 814 Clearwater Dr
- Lot 290 Pintail Dr
- TBD Slayton St
- Lot 130 Shadow Lake 2
- 812 Lake Tahoe Dr
- 907 Woodland Ave
- 9801 Overland Trail
- 9808 Overland Trail
- 2006 Diane St
- Lot 28 Ashbury Hills
- 12378 Lake Vista Dr
- 262 Ashbury Hills St
- 259 Ashbury Hils St
- 235 Lot St
- 1113 Edward St
- 1111 Edward St
- 12719 S 79th St
- 1508 Walnut Creek Dr
- 1510 Walnut Creek Dr
- 1120 Gold Coast Rd
- 1109 Edward St
- 1114 Edward St
- 1112 Edward St
- 1506 Walnut Creek Dr
- 1116 Edward St
- 1118 Gold Coast Rd
- 1110 Edward St
- 1512 Walnut Creek Dr
- 1116 Gold Coast Rd
- 1108 Edward St
- 1107 Edward St
- 1114 Gold Coast Rd
- 1106 Edward St
- 1114 Gold Coast Rd