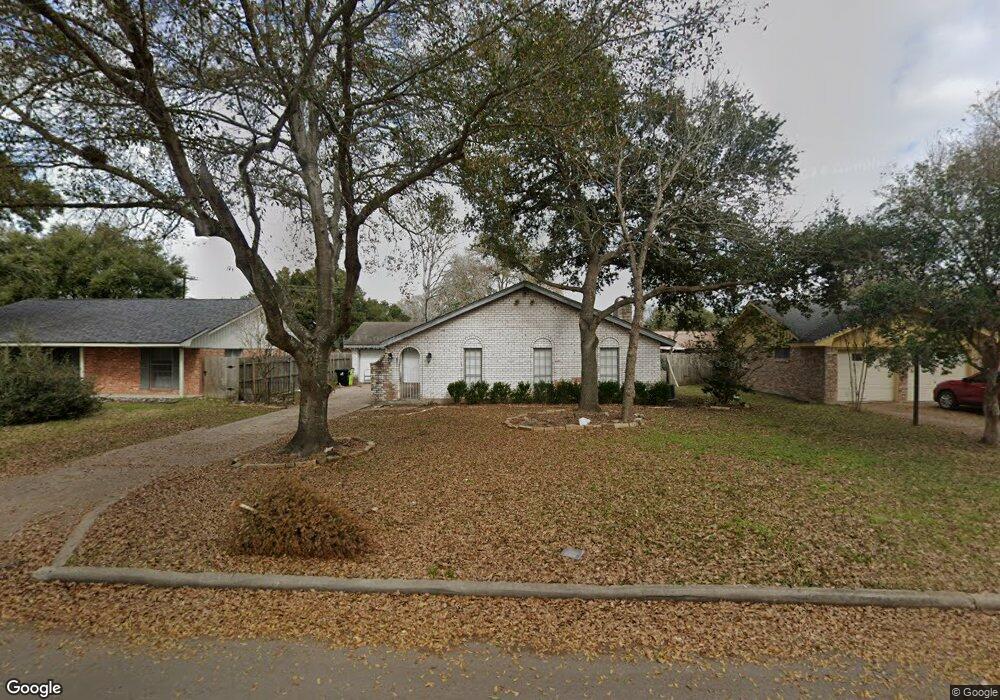
1115 Frances Dr Rosenberg, TX 77471
Estimated Value: $246,179 - $287,000
About This Home
This home is located at 1115 Frances Dr, Rosenberg, TX 77471 and is currently estimated at $272,295, approximately $146 per square foot. 1115 Frances Dr is a home located in Fort Bend County with nearby schools including Smith Elementary School, Lamar Junior High School, and Lamar Consolidated High School.
Ownership History
We collect this data history from publicly available records. To have your information removed, we recommend requesting removal directly through your county’s website.
Purchase Details
Home Financials for this Owner
Home Financials are based on the most recent Mortgage that was taken out on this home.Purchase Details
Home Financials for this Owner
Home Financials are based on the most recent Mortgage that was taken out on this home.Home Values in the Area
Average Home Value in this Area
Purchase History
We collect this data history from publicly available records. To have your information removed, we recommend requesting removal directly through your county’s website.
| Date | Buyer | Sale Price | Title Company |
|---|---|---|---|
| -- | First American Title | ||
| -- | North American Title Co | ||
| -- | -- |
Mortgage History
We collect this data history from publicly available records. To have your information removed, we recommend requesting removal directly through your county’s website.
| Date | Status | Borrower | Loan Amount |
|---|---|---|---|
| Open | $86,768 | ||
| Previous Owner | $45,450 |
Tax History
We collect this data history from publicly available records. To have your information removed, we recommend requesting removal directly through your county’s website.
| Year | Tax Paid | Tax Assessment Tax Assessment Total Assessment is a certain percentage of the fair market value that is determined by local assessors to be the total taxable value of land and additions on the property. | Land | Improvement |
|---|---|---|---|---|
| 2025 | $3,117 | $232,218 | $12,675 | $219,543 |
| 2024 | $3,117 | $245,001 | $3,685 | $241,316 |
| 2023 | $2,802 | $222,728 | $0 | $244,729 |
| 2022 | $3,324 | $202,480 | $0 | $238,150 |
| 2021 | $3,819 | $184,070 | $12,240 | $171,830 |
| 2020 | $3,606 | $169,920 | $12,240 | $157,680 |
| 2019 | $3,805 | $166,600 | $12,240 | $154,360 |
| 2018 | $3,802 | $163,800 | $12,240 | $151,560 |
| 2017 | $3,476 | $148,910 | $12,240 | $136,670 |
| 2016 | $3,160 | $135,370 | $12,240 | $123,130 |
| 2015 | $2,691 | $136,170 | $12,240 | $123,930 |
| 2014 | $2,584 | $123,790 | $12,240 | $111,550 |
Map
- 1808 Long Dr
- 904 Winston Dr
- 1302 Austin St
- 1215 Main St
- 2100 Crestwood Dr
- 1905 Dowling Dr
- 4534 Castor Dr
- 4618 Compass Ave
- 5015 Green Gate Trail
- 5303 Rivers Edge Dr
- 5323 Rivers Edge Dr
- 606 Fannin St
- 000 Fm 2218 Rd
- 0 Fm 2218 Unit 25550047
- 805 Chateau Place
- 604 Fairway Dr
- 2012 Briar Ln
- 206 Collins Rd
- 2016 Briar Ln
- 514 Travis St
- 1121 Frances Dr
- 1109 Frances Dr
- 1114 Timber Ln
- 1120 Timber Ln
- 1108 Timber Ln
- 1127 Frances Dr
- 1103 Frances Dr
- 1116 Frances Dr
- 1108 Frances Dr
- 1102 Timber Ln
- 1126 Frances Dr
- 1128 Timber Ln
- 1102 Frances Dr
- 1139 Frances Dr
- 1132 Frances Dr
- 1117 Lindsey Dr
- 1138 Timber Ln
- 1111 Lindsey Dr
- 1115 Timber Ln
- 1109 Timber Ln
Ask me questions while you tour the home.