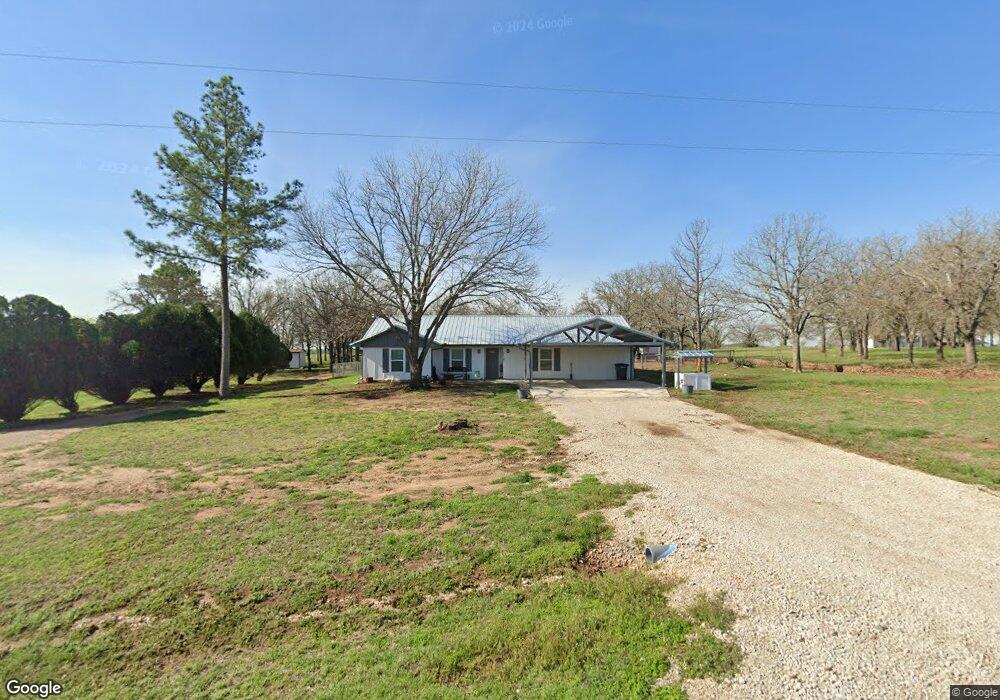
1115 Green Tree Dr Weatherford, TX 76087
Estimated Value: $454,000 - $551,000
4
Beds
2
Baths
2,544
Sq Ft
$206/Sq Ft
Est. Value
About This Home
This home is located at 1115 Green Tree Dr, Weatherford, TX 76087 and is currently estimated at $523,483, approximately $205 per square foot. 1115 Green Tree Dr is a home located in Parker County with nearby schools including Brock Intermediate School, Brock Junior High School, and Brock High School.
Ownership History
Date
Name
Owned For
Owner Type
Purchase Details
Closed on
Nov 20, 2020
Sold by
Rowland Arlene
Bought by
Dobbs Charles and Dobbs Connie
Current Estimated Value
Purchase Details
Closed on
Mar 5, 2010
Sold by
Fannie Mae
Bought by
Rowland Arlene and Rowland Tim
Purchase Details
Closed on
Jan 5, 2010
Sold by
Tanner Tammie J and Tanner Kevin
Bought by
Rowland Arlene and Rowland Tim
Purchase Details
Closed on
Jul 29, 2005
Sold by
Green David L and Green Judy
Bought by
Rowland Arlene and Rowland Tim
Home Financials for this Owner
Home Financials are based on the most recent Mortgage that was taken out on this home.
Original Mortgage
$32,400
Interest Rate
5.61%
Mortgage Type
Credit Line Revolving
Purchase Details
Closed on
Oct 29, 1999
Sold by
Bulsterbaum Billy F Etuxx
Bought by
Rowland Arlene and Rowland Tim
Create a Home Valuation Report for This Property
The Home Valuation Report is an in-depth analysis detailing your home's value as well as a comparison with similar homes in the area
Home Values in the Area
Average Home Value in this Area
Purchase History
| Date | Buyer | Sale Price | Title Company |
|---|---|---|---|
| Dobbs Charles | -- | Providence Title Company | |
| Rowland Arlene | -- | Rtt | |
| Rowland Arlene | -- | -- | |
| Federal National Mortgage Association | $139,648 | None Available | |
| Rowland Arlene | -- | -- | |
| Tanner Tammi J | -- | None Available | |
| Rowland Arlene | -- | -- |
Source: Public Records
Mortgage History
| Date | Status | Borrower | Loan Amount |
|---|---|---|---|
| Previous Owner | Tanner Tammi J | $32,400 | |
| Previous Owner | Tanner Tammi J | $129,600 |
Source: Public Records
Tax History Compared to Growth
Tax History
| Year | Tax Paid | Tax Assessment Tax Assessment Total Assessment is a certain percentage of the fair market value that is determined by local assessors to be the total taxable value of land and additions on the property. | Land | Improvement |
|---|---|---|---|---|
| 2025 | $3,579 | $335,550 | $138,800 | $196,750 |
| 2024 | $3,579 | $323,037 | -- | -- |
| 2023 | $3,579 | $293,670 | $0 | $0 |
| 2022 | $5,420 | $266,980 | $103,320 | $163,660 |
| 2021 | $5,700 | $266,980 | $103,320 | $163,660 |
| 2020 | $5,257 | $242,880 | $64,960 | $177,920 |
| 2019 | $5,661 | $242,880 | $64,960 | $177,920 |
| 2018 | $4,979 | $212,680 | $45,720 | $166,960 |
| 2017 | $4,893 | $212,680 | $45,720 | $166,960 |
| 2016 | $3,972 | $172,660 | $36,300 | $136,360 |
| 2015 | $3,921 | $172,660 | $36,300 | $136,360 |
| 2014 | $3,258 | $141,990 | $34,740 | $107,250 |
Source: Public Records
Map
Nearby Homes
- 1051 Kingsley Ct
- 304 Red Roan Ridge
- 400 Timber Wild Dr
- 3401 Fm 1189
- 2041 Verona Dr
- 2004 Verona Dr
- 2026 Verona Dr
- 2030 Verona Dr
- 2007 Verona Dr
- 2042 Verona Dr
- 734 Young Bend Rd
- 2053 Verona Dr
- TBD1 Farm To Market Road 1189
- 201 Pritchard Ln
- 3036 Palermo Dr
- 4000 Luciano Dr
- 219 Salt Creek Ct
- 223 Ruby Dr
- 100 Taylor Rd
- 215 Salt Creek Ct
- 1109 Green Tree Dr
- 1116 Green Tree Dr
- 1200 Green Tree Dr
- 1101 Green Tree Dr
- 1110 Green Tree Dr
- 1025 Green Tree Dr
- 1102 Green Tree Dr
- 7951 Old Brock Rd
- 8098 Old Brock Rd
- 8100 Old Brock Rd
- 821 Green Tree Dr
- 941 Timber Wild Dr
- 8104 Old Brock Rd
- 1008 Green Tree Dr
- 933 Timber Wild Dr
- 8108 Old Brock Rd
- 8284 Old Brock Rd
- 1005 Green Tree Dr
- 7855 Old Brock Rd
- 955 Timber Wild Dr