S
Landlord's Agent in 2014
Skip Barry
The Barry Group
Estimated Value: $921,000 - $1,088,000
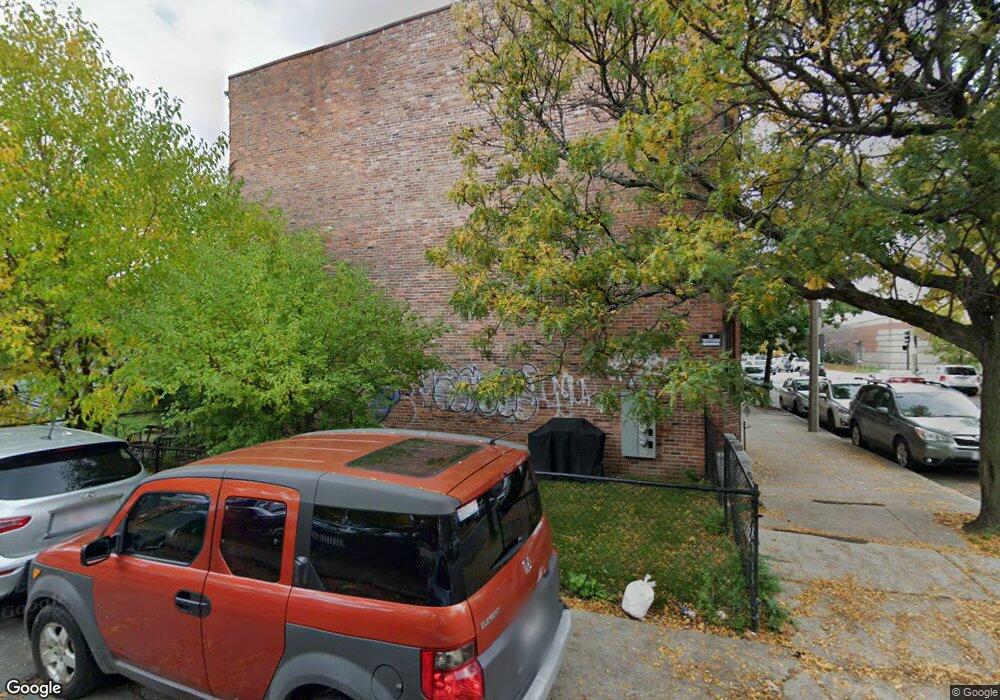
Sun-splashed very sunny 2BR apartment with beautiful hardwood floors available now. Heat included. Walk to Northeastern University, Nubian Square, Boston Medical Center. Transportation, cafes, supermarkets, shopping, and South End all minutes steps away. Very easy street parking. Plenty of storage. Easy to see. Available 9/1.
Last Agent to Rent the Property
Skip Barry
The Barry Group Listed on: 12/03/2014
Last Renter's Agent
Skip Barry
The Barry Group Listed on: 12/03/2014
Home Type
Other
Est. Annual Taxes
$10,419
Year Built
1890
Lot Details
0
| Date | Event | Price | List to Sale | Price per Sq Ft |
|---|---|---|---|---|
| 09/11/2025 09/11/25 | For Rent | $2,500 | +78.6% | -- |
| 12/03/2014 12/03/14 | Rented | $1,400 | 0.0% | -- |
| 12/03/2014 12/03/14 | For Rent | $1,400 | -- | -- |
| Year | Tax Paid | Tax Assessment Tax Assessment Total Assessment is a certain percentage of the fair market value that is determined by local assessors to be the total taxable value of land and additions on the property. | Land | Improvement |
|---|---|---|---|---|
| 2025 | $10,419 | $899,700 | $158,900 | $740,800 |
| 2024 | $9,253 | $848,900 | $167,100 | $681,800 |
| 2023 | $9,117 | $848,900 | $167,100 | $681,800 |
| 2022 | $8,791 | $808,000 | $159,000 | $649,000 |
| 2021 | $8,371 | $784,500 | $154,400 | $630,100 |
| 2020 | $7,109 | $673,200 | $159,000 | $514,200 |
| 2019 | $6,335 | $601,000 | $118,500 | $482,500 |
| 2018 | $5,889 | $561,900 | $118,500 | $443,400 |
| 2017 | $5,951 | $561,900 | $118,500 | $443,400 |
| 2016 | $5,521 | $501,900 | $118,500 | $383,400 |
| 2015 | $4,902 | $404,800 | $95,300 | $309,500 |
| 2014 | $4,804 | $381,900 | $95,300 | $286,600 |
S
Landlord's Agent in 2014
Skip Barry
The Barry Group
Source: MLS Property Information Network (MLS PIN)
MLS Number: 71773916
APN: ROXB-000000-000008-002460
Disclaimer: Certain information contained herein is derived from information provided by parties other than Homes.com. All information provided is deemed reliable, but is not guaranteed to be accurate and should be independently verified.
![]() The property listing data and information, or the Images, set forth herein were provided to MLS Property Information Network, Inc. from third party sources, including sellers, lessors and public records, and were compiled by MLS Property Information Network, Inc. The property listing data and information, and the Images, are for the personal, non-commercial use of consumers having a good faith interest in purchasing or leasing listed properties of the type displayed to them and may not be used for any purpose other than to identify prospective properties which such consumers may have a good faith interest in purchasing or leasing. MLS Property Information Network, Inc. and its subscribers disclaim any and all representations and warranties as to the accuracy of the property listing data and information, or as to the accuracy of any of the Images, set forth herein.
The property listing data and information, or the Images, set forth herein were provided to MLS Property Information Network, Inc. from third party sources, including sellers, lessors and public records, and were compiled by MLS Property Information Network, Inc. The property listing data and information, and the Images, are for the personal, non-commercial use of consumers having a good faith interest in purchasing or leasing listed properties of the type displayed to them and may not be used for any purpose other than to identify prospective properties which such consumers may have a good faith interest in purchasing or leasing. MLS Property Information Network, Inc. and its subscribers disclaim any and all representations and warranties as to the accuracy of the property listing data and information, or as to the accuracy of any of the Images, set forth herein.
