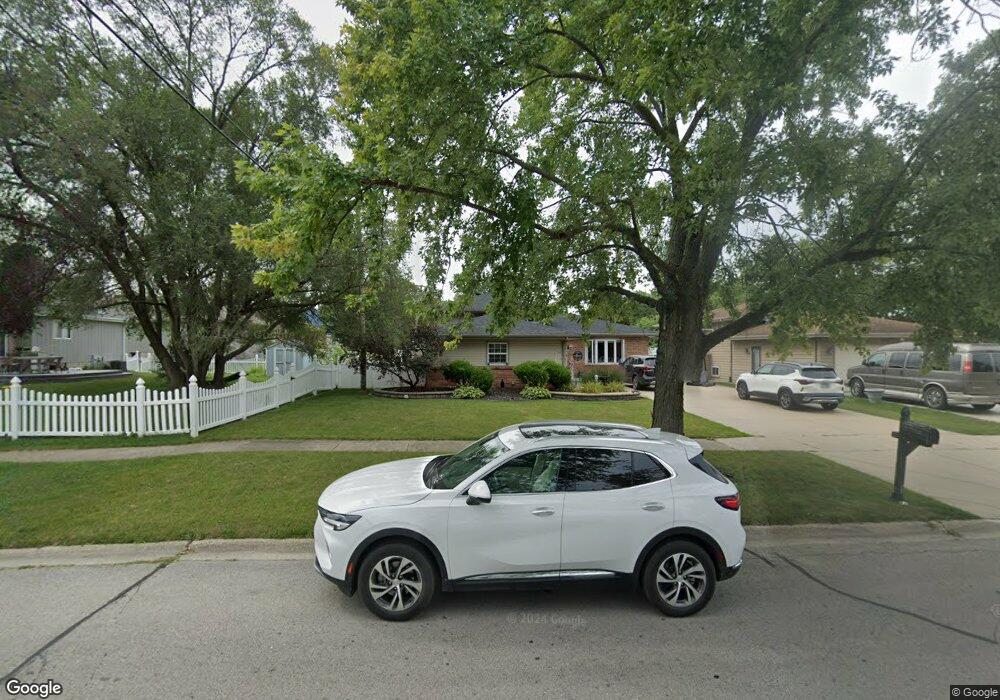
1115 Keywest Dr Lockport, IL 60441
Estimated Value: $285,715 - $391,000
Studio
--
Bath
1,470
Sq Ft
$235/Sq Ft
Est. Value
About This Home
This home is located at 1115 Keywest Dr, Lockport, IL 60441 and is currently estimated at $346,179, approximately $235 per square foot. 1115 Keywest Dr is a home located in Will County with nearby schools including Walsh Elementary School, Ludwig Elementary School, and Reed Elementary School.
Ownership History
Date
Name
Owned For
Owner Type
Purchase Details
Closed on
Apr 14, 2014
Sold by
Baio John R
Bought by
Baio Wendy A
Current Estimated Value
Purchase Details
Closed on
May 31, 2000
Sold by
Parhas Elias
Bought by
Baio John R and Baio Wendy A
Home Financials for this Owner
Home Financials are based on the most recent Mortgage that was taken out on this home.
Original Mortgage
$137,500
Interest Rate
8.14%
Purchase Details
Closed on
Dec 3, 1993
Sold by
Wasilewski Michael J and Wasilewski Tracey A
Bought by
Parhas Elias
Home Financials for this Owner
Home Financials are based on the most recent Mortgage that was taken out on this home.
Original Mortgage
$80,000
Interest Rate
6.82%
Create a Home Valuation Report for This Property
The Home Valuation Report is an in-depth analysis detailing your home's value as well as a comparison with similar homes in the area
Home Values in the Area
Average Home Value in this Area
Purchase History
| Date | Buyer | Sale Price | Title Company |
|---|---|---|---|
| Baio Wendy A | -- | None Available | |
| Baio John R | $147,500 | -- | |
| Parhas Elias | $125,833 | -- |
Source: Public Records
Mortgage History
| Date | Status | Borrower | Loan Amount |
|---|---|---|---|
| Previous Owner | Baio John R | $137,500 | |
| Previous Owner | Parhas Elias | $80,000 |
Source: Public Records
Tax History
| Year | Tax Paid | Tax Assessment Tax Assessment Total Assessment is a certain percentage of the fair market value that is determined by local assessors to be the total taxable value of land and additions on the property. | Land | Improvement |
|---|---|---|---|---|
| 2024 | $8,189 | $106,573 | $26,939 | $79,634 |
| 2023 | $8,189 | $95,675 | $24,184 | $71,491 |
| 2022 | $7,395 | $90,129 | $22,782 | $67,347 |
| 2021 | $6,956 | $84,700 | $21,410 | $63,290 |
| 2020 | $6,768 | $81,915 | $20,706 | $61,209 |
| 2019 | $6,380 | $77,645 | $19,627 | $58,018 |
| 2018 | $6,057 | $72,492 | $18,325 | $54,167 |
| 2017 | $5,588 | $66,441 | $16,795 | $49,646 |
| 2016 | $5,287 | $62,269 | $15,740 | $46,529 |
| 2015 | $4,922 | $58,085 | $14,682 | $43,403 |
| 2014 | $4,922 | $56,393 | $14,254 | $42,139 |
| 2013 | $4,922 | $61,971 | $15,664 | $46,307 |
Source: Public Records
Map
Nearby Homes
- 904 Cove Ave
- 0 151st & MacGregor St Unit MRD11873272
- 0 Smith Rd South of 135th St Unit MRD12274096
- 0 N State St Unit 10995892
- 1336 Tralee Ln
- 805 Maryknoll Dr
- 936 Treeline Ct Unit 5B
- 15303 S Oak Run Ct
- 514 N Lockwood Dr
- 16740 W Saddlewood Dr
- 927 Treeline Ct Unit A
- 16656 W Huntington Dr
- 310 Mccameron Ave
- 14934 S Hillside Dr
- 14838 S Hillside Dr
- 16542 Golden Valley Ln
- 16535 Golden Valley Ln
- 16553 W Golden Valley Ln
- 629 Thornton St
- 417 Thornton St
- 1113 Keywest Dr
- 917 Sherwood Ct
- 913 Sherwood Ct
- 1214 Harbor Dr
- 909 Sherwood Ct
- 1114 Key West Dr
- 1114 Keywest Dr
- 1002 Cove Ave
- 1210 Keywest Dr
- 909 Cove Ave
- 907 Cove Ave
- 905 Sherwood Ct
- 905 Cove Ave
- 1001 Cove Ave
- 1214 Keywest Dr
- 1219 Keywest Dr
- 1201 Harbor Dr Unit 1
- 1008 Cove Ave
- 1106 Keywest Dr
- 901 Cove Ave
Your Personal Tour Guide
Ask me questions while you tour the home.