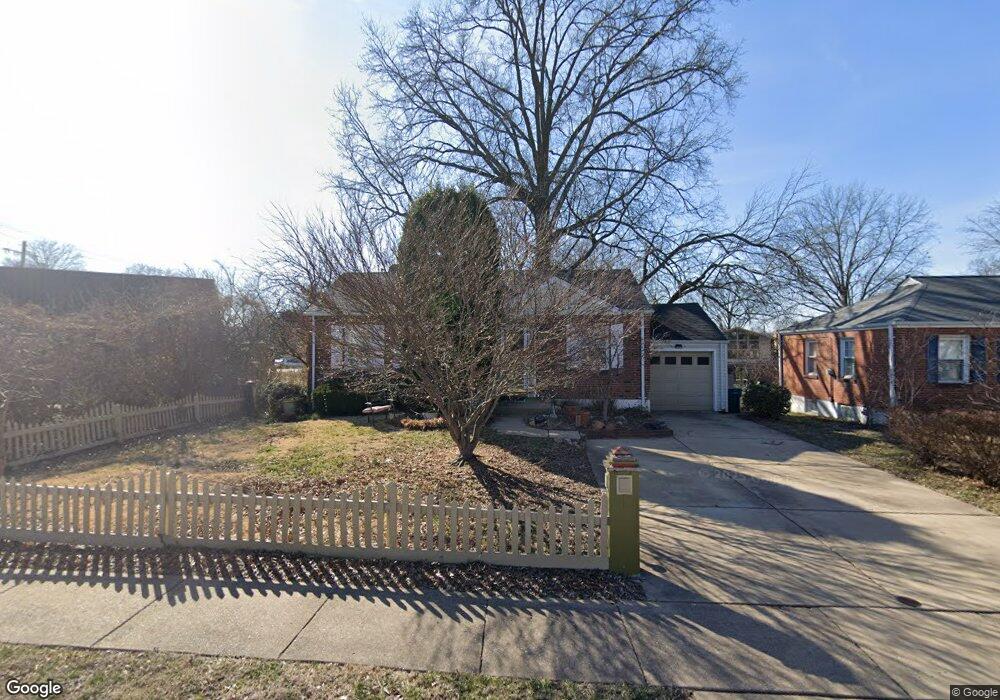
1115 N Geyer Rd Saint Louis, MO 63122
Estimated Value: $271,000 - $324,000
2
Beds
1
Bath
828
Sq Ft
$350/Sq Ft
Est. Value
About This Home
This home is located at 1115 N Geyer Rd, Saint Louis, MO 63122 and is currently estimated at $290,094, approximately $350 per square foot. 1115 N Geyer Rd is a home located in St. Louis County with nearby schools including Westchester Elementary School, North Kirkwood Middle School, and Kirkwood Senior High School.
Ownership History
Date
Name
Owned For
Owner Type
Purchase Details
Closed on
Sep 5, 2024
Sold by
Fears James
Bought by
Skeels Jay
Current Estimated Value
Purchase Details
Closed on
Jan 26, 2007
Sold by
Fears William James
Bought by
Fears James and James Fears Living Trust
Purchase Details
Closed on
Oct 20, 2006
Sold by
Pounds Melissa and Pounds Louis
Bought by
Fears William James
Home Financials for this Owner
Home Financials are based on the most recent Mortgage that was taken out on this home.
Original Mortgage
$110,000
Interest Rate
6.37%
Mortgage Type
Purchase Money Mortgage
Purchase Details
Closed on
May 22, 2006
Sold by
Pounds Melissa and Pounds Louis
Bought by
Pounds Louis and Pounds Melissa
Home Financials for this Owner
Home Financials are based on the most recent Mortgage that was taken out on this home.
Original Mortgage
$144,000
Interest Rate
6.5%
Mortgage Type
Fannie Mae Freddie Mac
Create a Home Valuation Report for This Property
The Home Valuation Report is an in-depth analysis detailing your home's value as well as a comparison with similar homes in the area
Home Values in the Area
Average Home Value in this Area
Purchase History
| Date | Buyer | Sale Price | Title Company |
|---|---|---|---|
| Skeels Jay | -- | None Listed On Document | |
| Fears James | -- | None Available | |
| Fears William James | $165,000 | None Available | |
| Pounds Louis | -- | None Available |
Source: Public Records
Mortgage History
| Date | Status | Borrower | Loan Amount |
|---|---|---|---|
| Previous Owner | Fears William James | $110,000 | |
| Previous Owner | Pounds Louis | $144,000 |
Source: Public Records
Tax History Compared to Growth
Tax History
| Year | Tax Paid | Tax Assessment Tax Assessment Total Assessment is a certain percentage of the fair market value that is determined by local assessors to be the total taxable value of land and additions on the property. | Land | Improvement |
|---|---|---|---|---|
| 2025 | $2,450 | $44,470 | $42,470 | $2,000 |
| 2024 | $2,450 | $38,780 | $27,800 | $10,980 |
| 2023 | $2,411 | $38,780 | $27,800 | $10,980 |
| 2022 | $2,240 | $33,590 | $21,620 | $11,970 |
| 2021 | $2,212 | $33,590 | $21,620 | $11,970 |
| 2020 | $2,192 | $32,010 | $24,680 | $7,330 |
| 2019 | $2,192 | $32,010 | $24,680 | $7,330 |
| 2018 | $2,251 | $29,040 | $18,530 | $10,510 |
| 2017 | $2,248 | $29,040 | $18,530 | $10,510 |
| 2016 | $2,143 | $27,880 | $18,530 | $9,350 |
| 2015 | $2,140 | $27,880 | $18,530 | $9,350 |
| 2014 | $1,922 | $24,450 | $9,880 | $14,570 |
Source: Public Records
Map
Nearby Homes
- 535 Kirkshire Dr
- 1112 Simmons Ave
- 966 N Geyer Rd
- 1003 Ormond Dr
- 11358 Manchester Rd
- 976 Cleveland Ave
- 923 Poinsetta Ln
- 1041 N Clay Ave Unit 19
- 930 Evans Ave
- 841 N Geyer Rd
- 212 Wilson Ave
- 241 Reedway Ln
- 946 Rochdale Dr
- 147 Maple Hill Ln
- 715 Westchester Ct
- 546 Dougherty Ferry Rd
- 812 Cleveland Ave
- 823 N Harrison Ave
- 811 Cherry St
- 550 Bedford Oaks Dr
- 1119 N Geyer Rd
- 1125 N Geyer Rd
- 1184 Laven Del Ln
- 1112 N Geyer Rd
- 1129 N Geyer Rd
- 1182 Laven Del Ln
- 1122 N Geyer Rd
- 1188 Laven Del Ln
- 1133 N Geyer Rd
- 1116 N Geyer Rd
- 1128 N Geyer Rd
- 1130 N Geyer Rd
- 1139 N Geyer Rd
- 1192 Laven Del Ln
- 1185 Laven Del Ln
- 11208 Manchester Rd
- 1136 N Geyer Rd
- 1143 N Geyer Rd
- 1183 Laven Del Ln
- 1047 N Geyer Rd