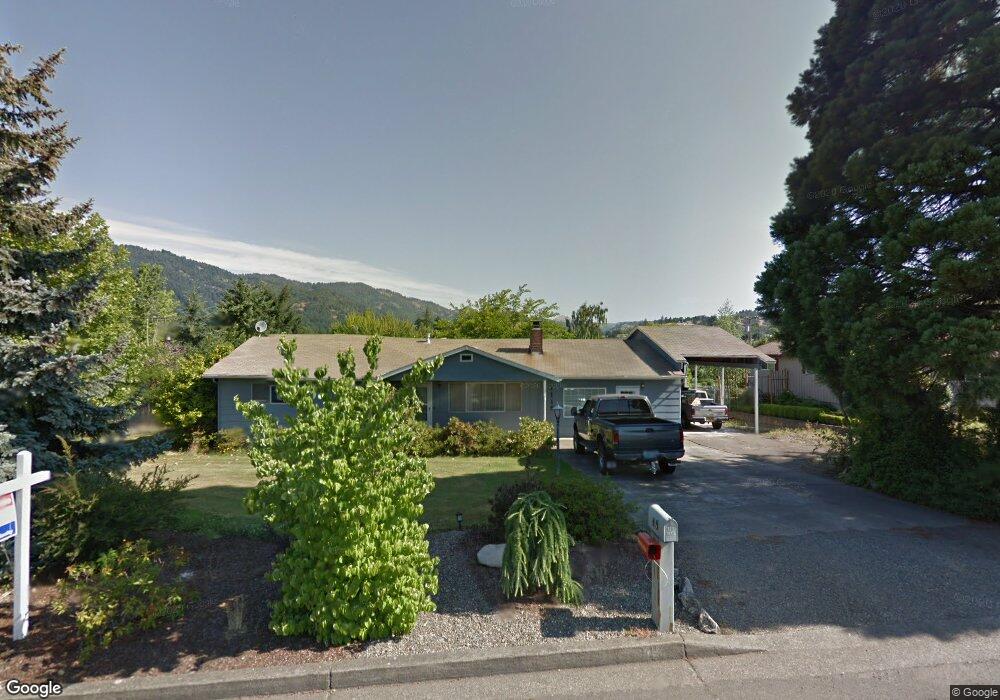
1115 SE Myrtle View Dr Myrtle Creek, OR 97457
Estimated Value: $359,000 - $421,000
3
Beds
2
Baths
1,736
Sq Ft
$219/Sq Ft
Est. Value
About This Home
This home is located at 1115 SE Myrtle View Dr, Myrtle Creek, OR 97457 and is currently estimated at $381,011, approximately $219 per square foot. 1115 SE Myrtle View Dr is a home located in Douglas County with nearby schools including South Umpqua High School.
Ownership History
Date
Name
Owned For
Owner Type
Purchase Details
Closed on
Apr 26, 2013
Sold by
Doud Blake L
Bought by
Willett Jason C
Current Estimated Value
Home Financials for this Owner
Home Financials are based on the most recent Mortgage that was taken out on this home.
Original Mortgage
$153,225
Outstanding Balance
$109,160
Interest Rate
3.6%
Mortgage Type
VA
Estimated Equity
$271,851
Purchase Details
Closed on
Jun 12, 2006
Sold by
Doud Chris K
Bought by
Doud Blake L
Home Financials for this Owner
Home Financials are based on the most recent Mortgage that was taken out on this home.
Original Mortgage
$212,000
Interest Rate
6.56%
Mortgage Type
Fannie Mae Freddie Mac
Purchase Details
Closed on
Jul 21, 2005
Sold by
Doud Blake L and Doud Chris K
Bought by
Doud Blake L and Doud Chris K
Home Financials for this Owner
Home Financials are based on the most recent Mortgage that was taken out on this home.
Original Mortgage
$171,000
Interest Rate
5.51%
Mortgage Type
Fannie Mae Freddie Mac
Create a Home Valuation Report for This Property
The Home Valuation Report is an in-depth analysis detailing your home's value as well as a comparison with similar homes in the area
Home Values in the Area
Average Home Value in this Area
Purchase History
| Date | Buyer | Sale Price | Title Company |
|---|---|---|---|
| Willett Jason C | $150,000 | First American Title | |
| Doud Blake L | -- | Amerititle Inc | |
| Doud Blake L | -- | Amerititle Inc |
Source: Public Records
Mortgage History
| Date | Status | Borrower | Loan Amount |
|---|---|---|---|
| Open | Willett Jason C | $153,225 | |
| Previous Owner | Doud Blake L | $212,000 | |
| Previous Owner | Doud Blake L | $171,000 |
Source: Public Records
Tax History Compared to Growth
Tax History
| Year | Tax Paid | Tax Assessment Tax Assessment Total Assessment is a certain percentage of the fair market value that is determined by local assessors to be the total taxable value of land and additions on the property. | Land | Improvement |
|---|---|---|---|---|
| 2024 | $2,536 | $189,621 | -- | -- |
| 2023 | $2,462 | $184,099 | $0 | $0 |
| 2022 | $2,391 | $178,737 | $0 | $0 |
| 2021 | $2,321 | $173,532 | $0 | $0 |
| 2020 | $2,253 | $168,478 | $0 | $0 |
| 2019 | $2,188 | $163,571 | $0 | $0 |
| 2018 | $2,124 | $158,807 | $0 | $0 |
| 2017 | $2,062 | $154,182 | $0 | $0 |
| 2016 | $1,992 | $149,692 | $0 | $0 |
| 2015 | $1,939 | $145,333 | $0 | $0 |
| 2014 | $1,887 | $141,100 | $0 | $0 |
| 2013 | -- | $136,991 | $0 | $0 |
Source: Public Records
Map
Nearby Homes
- 195 NE Sandy Terrace
- 0 NE Simpson Ln Unit 734646510
- 1357 NE Ballard Ct
- 231 Chestnut St
- 961 NE Broadway St
- 1682 Riverside Dr
- 1682 NE Riverside Dr
- 650 SE Riverside Dr
- 455 Woody Ct
- 119 Forest Rd
- 629 NE Johnson St
- 910 NE Leon Ave
- 407 NE Waite St
- 206 NE Laurel Ave
- 217 SE Mill St
- 186 NE Division St
- 195 SE Mill St
- 769 NE Christian St
- 1056 NE Orchard Dr
- 728 NW Morrison Ave
- 1137 SE Myrtle View Dr
- 1140 SE Myrtle View
- 225 SE Stevenson Ave
- 1081 SE Myrtle View Dr
- 1142 Malibu Dr
- 1161 SE Myrtle View Dr
- 1168 Malibu Dr
- 1114 SE Myrtle View Dr
- 230 SE Stevenson Ave
- 1140 SE Myrtle View Dr
- 1055 SE Myrtle View Dr
- 1082 SE Myrtle View Dr
- 220 SE Stevenson Ave
- 1177 SE Myrtle View Dr
- 1160 SE Myrtle View Dr
- 121 SE Stevenson Ave
- 1143 Malibu Dr
- 210 SE Elizabeths Ct
- 1060 SE Myrtle View Dr
- 1167 Malibu Dr