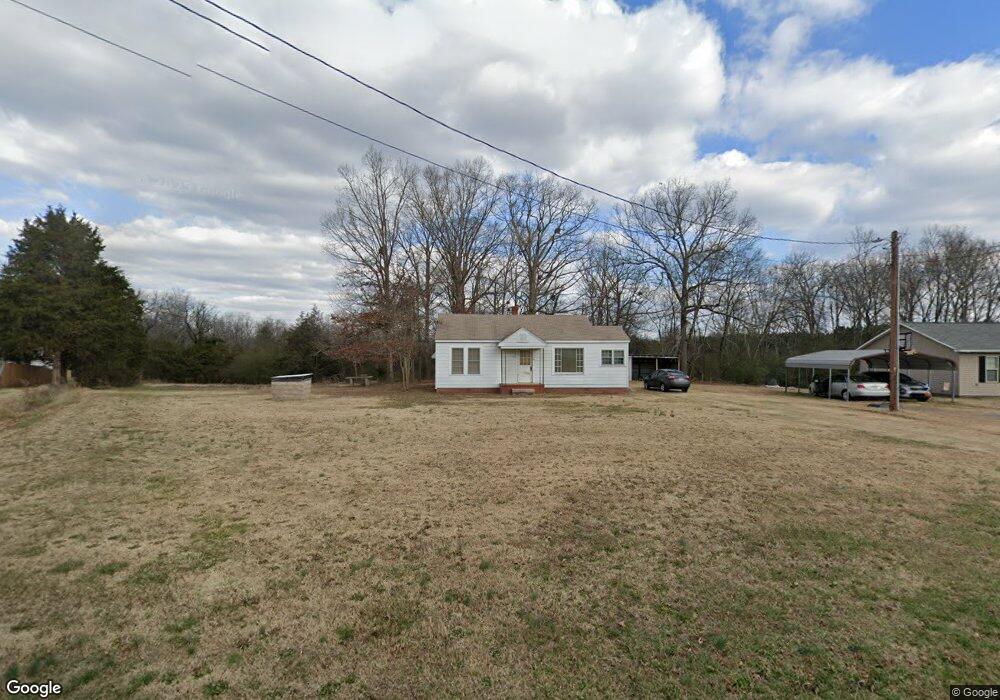
1115 Shuping Mill Rd Salisbury, NC 28146
Estimated Value: $88,000 - $782,000
--
Bed
1
Bath
912
Sq Ft
$337/Sq Ft
Est. Value
About This Home
This home is located at 1115 Shuping Mill Rd, Salisbury, NC 28146 and is currently estimated at $307,252, approximately $336 per square foot. 1115 Shuping Mill Rd is a home located in Rowan County with nearby schools including Ethan H Shive Elementary School, China Grove Middle School, and Jesse C Carson High School.
Ownership History
Date
Name
Owned For
Owner Type
Purchase Details
Closed on
Oct 29, 2019
Sold by
Thomas Chipper E
Bought by
Cet Management Llc
Current Estimated Value
Purchase Details
Closed on
May 15, 2009
Sold by
Thomas Chipper E and Thomas Leanne H
Bought by
Thomas Chipper E
Purchase Details
Closed on
Apr 7, 2006
Sold by
Overcash Leslie Stevenson and Allen Overcash Eunice
Bought by
Thomas Chipper E and Thomas Leanne H
Purchase Details
Closed on
Oct 14, 2005
Sold by
Lester C Overcash Inc
Bought by
Overcash Leslie Stevenson and Outen Deborah Overcash
Purchase Details
Closed on
Mar 18, 2005
Sold by
Overcash Leslie Stevenson and Allen Overcash Eunice W
Bought by
Overcash Lester Clarence and Overcash Leslie Stevenson
Purchase Details
Closed on
Mar 16, 2005
Sold by
Overcash Lester Clarence
Bought by
Overcash Lester Clarence and Overchas Leslie Stevenson
Create a Home Valuation Report for This Property
The Home Valuation Report is an in-depth analysis detailing your home's value as well as a comparison with similar homes in the area
Home Values in the Area
Average Home Value in this Area
Purchase History
| Date | Buyer | Sale Price | Title Company |
|---|---|---|---|
| Cet Management Llc | -- | None Available | |
| Thomas Chipper E | -- | None Available | |
| Thomas Chipper E | $40,000 | Chicago Title Insurance Co | |
| Overcash Leslie Stevenson | -- | None Available | |
| Lester C Overcash Inc | -- | None Available | |
| Overcash Lester Clarence | -- | None Available | |
| Overcash Lester Clarence | -- | None Available | |
| Overcash Lester Clarence | -- | -- | |
| Overcash Lester Clarence | -- | -- |
Source: Public Records
Tax History Compared to Growth
Tax History
| Year | Tax Paid | Tax Assessment Tax Assessment Total Assessment is a certain percentage of the fair market value that is determined by local assessors to be the total taxable value of land and additions on the property. | Land | Improvement |
|---|---|---|---|---|
| 2025 | $641 | $95,599 | $28,979 | $66,620 |
| 2024 | $641 | $95,599 | $28,979 | $66,620 |
| 2023 | $641 | $95,599 | $28,979 | $66,620 |
| 2022 | $496 | $66,296 | $24,305 | $41,991 |
| 2021 | $492 | $66,296 | $24,305 | $41,991 |
| 2020 | $492 | $66,296 | $24,305 | $41,991 |
| 2019 | $492 | $66,296 | $24,305 | $41,991 |
| 2018 | $433 | $58,827 | $24,304 | $34,523 |
| 2017 | $433 | $58,827 | $24,304 | $34,523 |
| 2016 | $433 | $58,827 | $24,304 | $34,523 |
| 2015 | $439 | $58,827 | $24,304 | $34,523 |
| 2014 | $419 | $58,889 | $24,304 | $34,585 |
Source: Public Records
Map
Nearby Homes
- 225 Lm Overcash Rd
- 4550 Cook Rd
- 4505 Cook Rd
- 294 Wingate Ln
- 295 Wingate Ln
- 5604 N Carolina 152
- 130 Happy Hollow Rd
- 130 Happy Hollow Rd Unit 13/B
- 1008 Courtney Ln Unit 28
- 175 Sun Valley Dr
- 35 Happy Hollow Rd
- 1045 Churchfield Ln
- 9060 Castor Rd
- 107 Mink Dr
- 323 Farm Estates Dr
- 362 Farm Estates Dr
- 9990 Old Concord Rd
- 250 Farm Estates Dr
- 245 Farm Estates Dr
- 8900 Old Concord Rd
- 1055 Shuping Mill Rd
- 1095 Shuping Mill Rd
- 1045 Shuping Mill Rd
- 1015 Shuping Mill Rd
- 1110 Shuping Mill Rd
- 110 Shive Rd
- L4 Shuping Mill Rd
- 170 Shuping Mill Rd
- 120 Goodwin Rd
- 1145 Shuping Mill Rd
- 955 Shuping Mill Rd
- 1250 Rock Grove Church Rd
- 1050 Shuping Mill Rd
- 170 Goodwin Rd
- 1220 Shuping Mill Rd
- 240 Shive Rd
- 205 Shive Rd
- 0 Lm Overcash Rd
- 00 Lm Overcash Rd
- 1310 Shuping Mill Rd