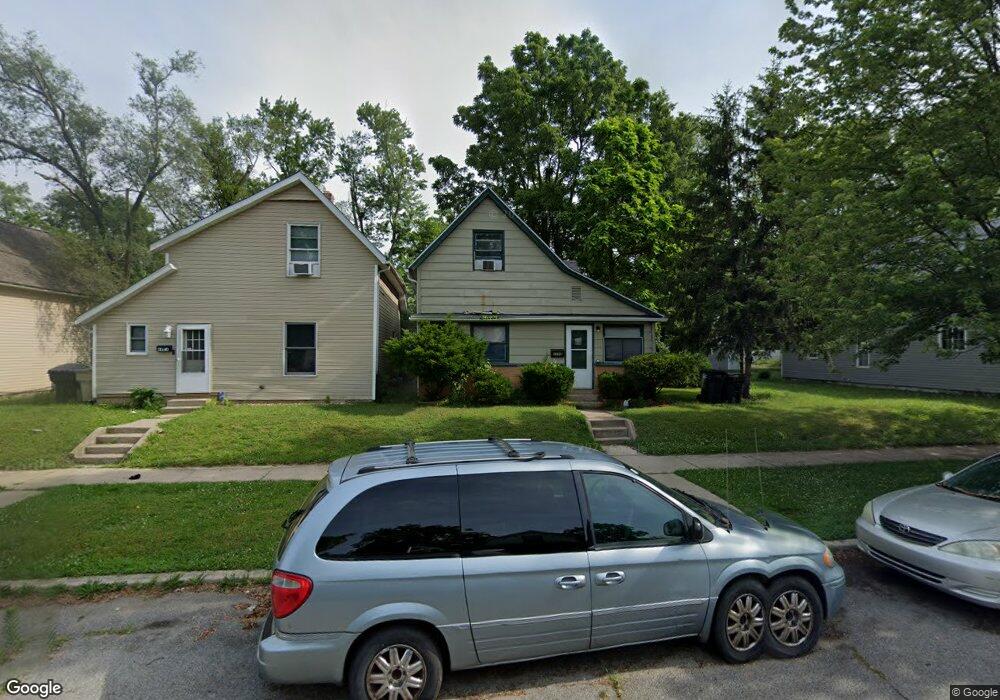
1115 Sorin St South Bend, IN 46617
Northeast South Bend NeighborhoodEstimated Value: $70,000 - $218,000
3
Beds
1
Bath
1,520
Sq Ft
$101/Sq Ft
Est. Value
About This Home
This home is located at 1115 Sorin St, South Bend, IN 46617 and is currently estimated at $152,918, approximately $100 per square foot. 1115 Sorin St is a home located in St. Joseph County with nearby schools including Nuner Fine Arts Academy, Clay Intermediate Center, and Jefferson Intermediate Traditional School.
Ownership History
Date
Name
Owned For
Owner Type
Purchase Details
Closed on
Feb 4, 2022
Sold by
Realty Plus Inc
Bought by
Kuleana Holdings Llc
Current Estimated Value
Home Financials for this Owner
Home Financials are based on the most recent Mortgage that was taken out on this home.
Original Mortgage
$37,606
Outstanding Balance
$18,468
Interest Rate
3.45%
Mortgage Type
New Conventional
Estimated Equity
$134,450
Purchase Details
Closed on
Dec 6, 2019
Sold by
Tmq Properties Llc
Bought by
Realty Plus Inc
Purchase Details
Closed on
Nov 29, 2010
Sold by
Wohlgemuth Thomas C and Wohgemuth Thomas C
Bought by
Tmq Properties Llc
Purchase Details
Closed on
Nov 11, 2009
Sold by
Jester Lance
Bought by
Brown Sherry
Purchase Details
Closed on
Nov 8, 2008
Sold by
Brown Sherry
Bought by
Wohgemuth Thomas C
Purchase Details
Closed on
May 6, 2005
Sold by
Argent Mortgage Co Llc
Bought by
Deutsche Bank National Trust Co
Purchase Details
Closed on
May 5, 2005
Sold by
Niccum Lonnie
Bought by
Argent Mortgage Company Llc
Create a Home Valuation Report for This Property
The Home Valuation Report is an in-depth analysis detailing your home's value as well as a comparison with similar homes in the area
Home Values in the Area
Average Home Value in this Area
Purchase History
| Date | Buyer | Sale Price | Title Company |
|---|---|---|---|
| Realty Plus Inc | -- | None Listed On Document | |
| Tmq Properties Llc | -- | Metropolitan Title In Llc | |
| Brown Sherry | -- | None Available | |
| Wohgemuth Thomas C | -- | None Available | |
| Deutsche Bank National Trust Co | -- | None Available | |
| Argent Mortgage Company Llc | $59,078 | None Available | |
| Kuleana Holdings Llc | $55,000 | None Listed On Document |
Source: Public Records
Mortgage History
| Date | Status | Borrower | Loan Amount |
|---|---|---|---|
| Open | Kuleana Holdings Llc | $37,606 |
Source: Public Records
Tax History Compared to Growth
Tax History
| Year | Tax Paid | Tax Assessment Tax Assessment Total Assessment is a certain percentage of the fair market value that is determined by local assessors to be the total taxable value of land and additions on the property. | Land | Improvement |
|---|---|---|---|---|
| 2024 | $1,163 | $47,000 | $7,700 | $39,300 |
| 2023 | $1,128 | $47,000 | $7,700 | $39,300 |
| 2022 | $1,128 | $47,000 | $7,700 | $39,300 |
| 2021 | $1,063 | $42,500 | $6,400 | $36,100 |
| 2020 | $1,063 | $42,500 | $6,400 | $36,100 |
| 2019 | $489 | $22,300 | $6,400 | $15,900 |
| 2018 | $575 | $22,300 | $6,400 | $15,900 |
| 2017 | $594 | $22,200 | $6,400 | $15,800 |
| 2016 | $607 | $22,200 | $6,400 | $15,800 |
| 2014 | $575 | $22,000 | $6,400 | $15,600 |
Source: Public Records
Map
Nearby Homes
- 602 N Frances St
- 509 N Arthur St
- 1229 Miner St
- 1222 Miner St
- 624 C N Notre Dame Ave
- 624 A N Notre Dame Ave Unit A
- 626 N Notre Dame Ave
- 469 N Eddy (Lot 25) St Unit lot 25
- VL Adj to 511 N Notre Dame Ave
- 461 N Eddy (Lot 21) St Unit Lot 21
- 734 N Notre Dame Ave Unit 1A
- 734 N Notre Dame Ave Unit 3
- 734 N Notre Dame Ave Unit 1B
- 734 N Notre Dame Ave Unit 2
- 421 N Eddy (Lot 1) St Unit Lot 1
- 1303 Sorin St
- 748 N Notre Dame Ave
- 754 N Notre Dame Ave
- 805 Miner St
- 1334 Chalfant St