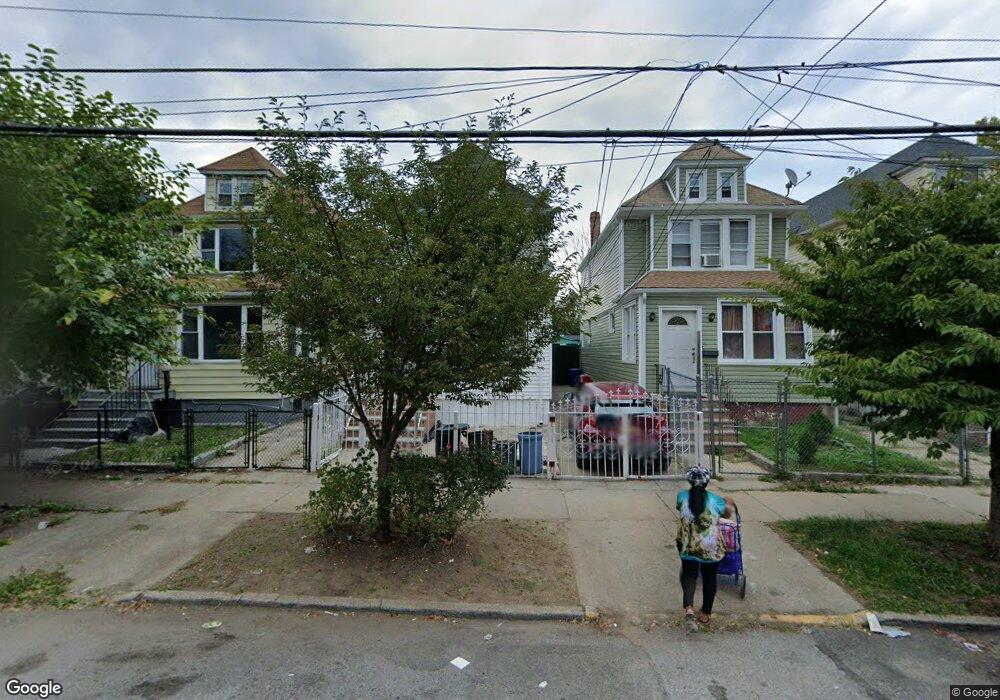
11151 130th St South Ozone Park, NY 11420
South Ozone Park NeighborhoodEstimated Value: $778,780 - $926,000
--
Bed
--
Bath
1,288
Sq Ft
$667/Sq Ft
Est. Value
About This Home
This home is located at 11151 130th St, South Ozone Park, NY 11420 and is currently estimated at $859,195, approximately $667 per square foot. 11151 130th St is a home located in Queens County with nearby schools including P.S. 155, J.H.S. 226 Virgil I. Grisson, and Al-Ihsan Academy.
Ownership History
Date
Name
Owned For
Owner Type
Purchase Details
Closed on
May 17, 2023
Sold by
J & H Hong Da Llc
Bought by
Gayadin Gangadhar and Gayadin Sadhana
Current Estimated Value
Home Financials for this Owner
Home Financials are based on the most recent Mortgage that was taken out on this home.
Original Mortgage
$707,200
Outstanding Balance
$686,328
Interest Rate
6.27%
Mortgage Type
Purchase Money Mortgage
Estimated Equity
$172,867
Purchase Details
Closed on
Aug 25, 2017
Sold by
Chen Mei Yun and Zou Hong
Bought by
J & H Hong Da Llc
Purchase Details
Closed on
Aug 15, 2017
Sold by
Richard Anthony Piccola Esq
Bought by
Chen Mei Yun and Zou Hong
Purchase Details
Closed on
Mar 31, 2006
Sold by
Padilla and Agustin
Bought by
Marquez Juan D
Home Financials for this Owner
Home Financials are based on the most recent Mortgage that was taken out on this home.
Original Mortgage
$108,600
Interest Rate
6.28%
Create a Home Valuation Report for This Property
The Home Valuation Report is an in-depth analysis detailing your home's value as well as a comparison with similar homes in the area
Home Values in the Area
Average Home Value in this Area
Purchase History
| Date | Buyer | Sale Price | Title Company |
|---|---|---|---|
| Gayadin Gangadhar | $832,000 | -- | |
| Gayadin Gangadhar | $832,000 | -- | |
| J & H Hong Da Llc | -- | -- | |
| J & H Hong Da Llc | -- | -- | |
| Chen Mei Yun | $380,000 | -- | |
| Chen Mei Yun | $380,000 | -- | |
| Marquez Juan D | $543,000 | -- | |
| Marquez Juan D | $543,000 | -- |
Source: Public Records
Mortgage History
| Date | Status | Borrower | Loan Amount |
|---|---|---|---|
| Open | Gayadin Gangadhar | $707,200 | |
| Closed | Gayadin Gangadhar | $707,200 | |
| Previous Owner | Marquez Juan D | $108,600 | |
| Previous Owner | Marquez Juan D | $434,400 |
Source: Public Records
Tax History Compared to Growth
Tax History
| Year | Tax Paid | Tax Assessment Tax Assessment Total Assessment is a certain percentage of the fair market value that is determined by local assessors to be the total taxable value of land and additions on the property. | Land | Improvement |
|---|---|---|---|---|
| 2025 | $5,872 | $30,954 | $6,295 | $24,659 |
| 2024 | $5,872 | $29,237 | $6,760 | $22,477 |
| 2023 | $5,613 | $27,946 | $6,241 | $21,705 |
| 2022 | $5,321 | $39,480 | $9,420 | $30,060 |
| 2021 | $5,610 | $39,900 | $9,420 | $30,480 |
| 2020 | $5,460 | $35,340 | $9,420 | $25,920 |
| 2019 | $5,097 | $36,180 | $9,420 | $26,760 |
| 2018 | $4,747 | $23,288 | $7,730 | $15,558 |
| 2017 | $4,528 | $22,213 | $6,518 | $15,695 |
| 2016 | $4,441 | $22,213 | $6,518 | $15,695 |
| 2015 | $2,527 | $21,496 | $9,167 | $12,329 |
| 2014 | $2,527 | $20,304 | $10,391 | $9,913 |
Source: Public Records
Map
Nearby Homes
- 11143 130th St
- 111-41 128th St
- 114-29 130th St
- 11158 128th St
- 114-50 130th St
- 114-09 127th St
- 11455 131st St
- 111-17 133rd St
- 114-27 127th St
- 114-33 133rd St
- 131-16 115th Ave
- 109-49 132nd St
- 109-35 131st St
- 11432 127th St
- 109-41 132nd St
- 11444 127th St
- 11406 135th St
- 134-01 Linden Blvd
- 114-39 134th St
- 10922 132nd St
- 111-49 130th St
- 11151 130th St
- 11151 130th St
- 11151 130th St Unit 2nd FL
- 11149 130th St
- 11153 130th St
- 11155 130th St
- 11147 130th St
- 11155 130th St
- 11159 130th St
- 11159 130th St
- 11145 130th St
- 12909 Linden Blvd
- 11143 130th St
- 11154 131st St
- 11156 131st St
- 11150 131st St
- 11158 131st St
- 11148 131st St
- 11139 130th St