R
Landlord's Agent in 2012
Rick Keller
Keller N Jadd
(702) 400-6000
1 Total Sale
Estimated Value: $498,269 - $528,000
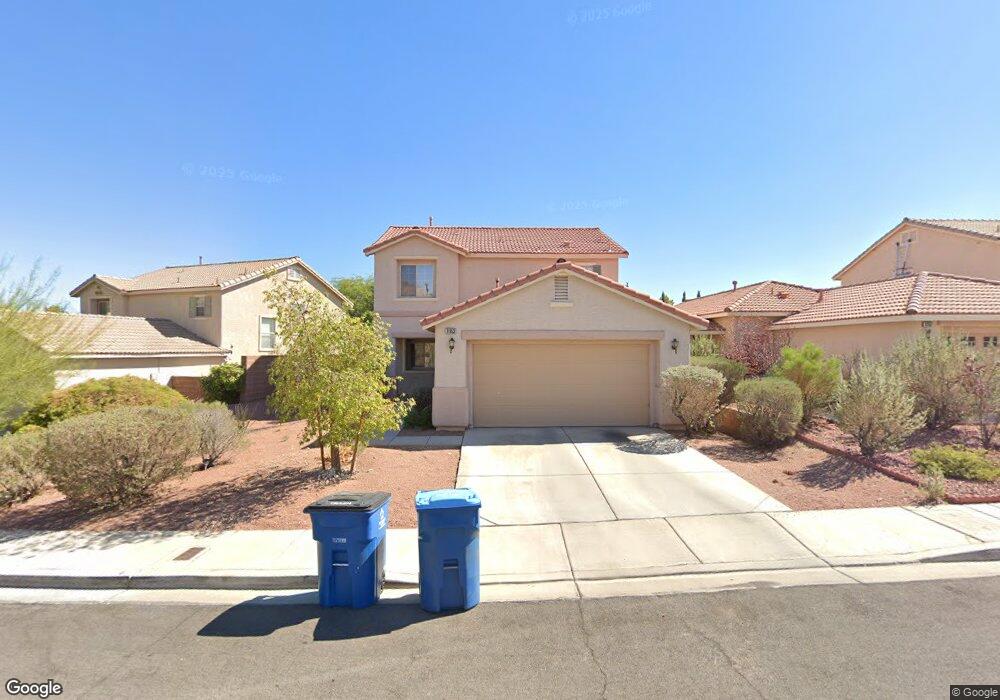
NICE 2 STORY 3 BEDROOM HOME IN GREAT NEIGHBORHOOD. OPEN FLOORPLAN WITH LARGE LIVING ROOM WITH FIREPLACE. SPACIOUS KITCHEN. ALL APPLIANCES INCLUDED! LARGE MASTER BEDROOM AND GOOD SIZE ROOMS!! LARGE BACKYARD. A MUST SEE!!
| Date | Buyer | Sale Price | Title Company |
|---|---|---|---|
| Kagan Manny | -- | Old Republic Title Co Of Ne | |
| Kagan Manny | -- | Old Republic Title Co Of Ne | |
| Kagan Manny | -- | -- | |
| Kagan Manny | $159,900 | Old Republic Title Company | |
| George Christopher | $149,578 | First American Title Co |
| Date | Status | Borrower | Loan Amount |
|---|---|---|---|
| Open | Kagan Manny | $100,000 |
| Date | Event | Price | List to Sale | Price per Sq Ft |
|---|---|---|---|---|
| 04/09/2012 04/09/12 | Rented | $1,250 | 0.0% | -- |
| 03/10/2012 03/10/12 | Under Contract | -- | -- | -- |
| 01/05/2012 01/05/12 | For Rent | $1,250 | -- | -- |
| Year | Tax Paid | Tax Assessment Tax Assessment Total Assessment is a certain percentage of the fair market value that is determined by local assessors to be the total taxable value of land and additions on the property. | Land | Improvement |
|---|---|---|---|---|
| 2025 | $2,796 | $110,712 | $47,600 | $63,112 |
| 2024 | $2,590 | $110,712 | $47,600 | $63,112 |
| 2023 | $1,724 | $96,615 | $36,750 | $59,865 |
| 2022 | $2,398 | $87,894 | $33,250 | $54,644 |
| 2021 | $2,221 | $80,754 | $28,700 | $52,054 |
| 2020 | $2,059 | $77,185 | $25,550 | $51,635 |
| 2019 | $1,930 | $74,284 | $23,450 | $50,834 |
| 2018 | $1,841 | $66,225 | $20,300 | $45,925 |
| 2017 | $2,108 | $64,120 | $17,850 | $46,270 |
| 2016 | $1,724 | $61,847 | $15,400 | $46,447 |
| 2015 | $1,720 | $56,679 | $10,850 | $45,829 |
| 2014 | $1,667 | $54,368 | $8,750 | $45,618 |
R
Landlord's Agent in 2012
Rick Keller
Keller N Jadd
(702) 400-6000
1 Total Sale

Tenant's Agent in 2012
Martin Toumaian
Keller Williams Realty Las Veg
(702) 219-8601
3 in this area
9 Total Sales
Source: Las Vegas REALTORS®
MLS Number: 1214691
APN: 137-23-811-083
Disclaimer: Certain information contained herein is derived from information provided by parties other than Homes.com. All information provided is deemed reliable, but is not guaranteed to be accurate and should be independently verified.
![]() The data relating to real estate for sale on this web site comes in part from the INTERNET DATA EXCHANGE Program of the Greater Las Vegas Association of REALTORS® MLS. Real estate listings held by brokerage firms other than this site owner are marked with the IDX logo. Information is deemed reliable but not guaranteed. Copyright 2025 of the Greater Las Vegas Association of REALTORS® MLS. All rights reserved.
The data relating to real estate for sale on this web site comes in part from the INTERNET DATA EXCHANGE Program of the Greater Las Vegas Association of REALTORS® MLS. Real estate listings held by brokerage firms other than this site owner are marked with the IDX logo. Information is deemed reliable but not guaranteed. Copyright 2025 of the Greater Las Vegas Association of REALTORS® MLS. All rights reserved.