Estimated Value: $103,000 - $150,000
3
Beds
2
Baths
1,152
Sq Ft
$110/Sq Ft
Est. Value
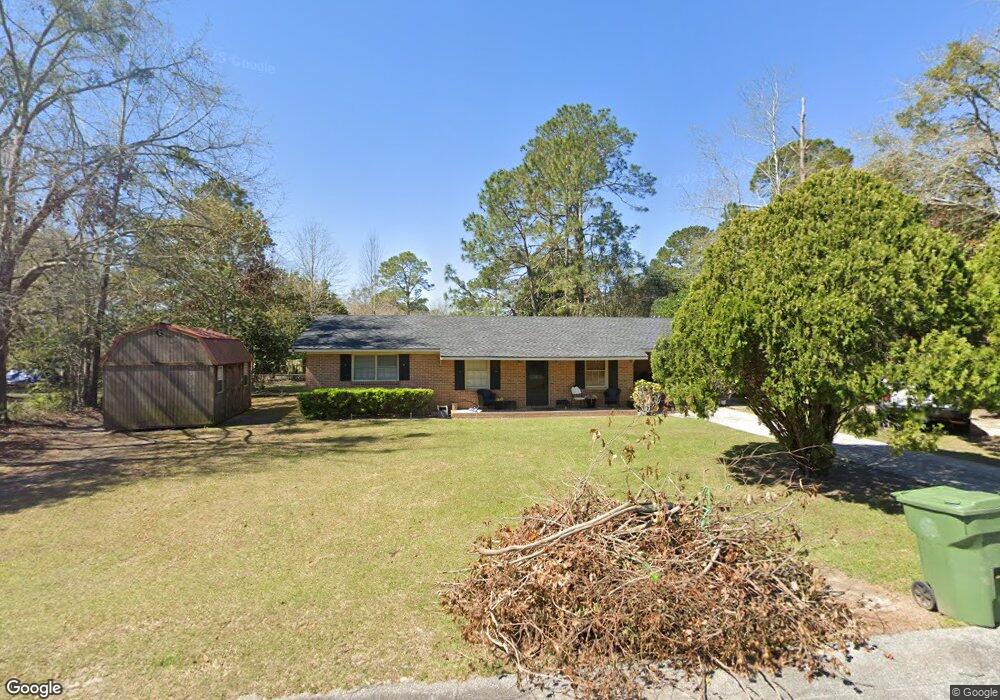
About This Home
This home is located at 1116 Debbie St, Adel, GA 31620 and is currently estimated at $126,676, approximately $109 per square foot. 1116 Debbie St is a home located in Cook County with nearby schools including Cook Primary School, Cook Elementary School, and Cook County Middle School.
Ownership History
Date
Name
Owned For
Owner Type
Purchase Details
Closed on
Apr 23, 2020
Sold by
Stones Development Inc
Bought by
Stone Ridge Rentals Llc
Current Estimated Value
Purchase Details
Closed on
Mar 31, 2014
Sold by
Nationstar Mtg Llc
Bought by
Stones Development Inc
Purchase Details
Closed on
Mar 25, 2009
Sold by
Hsbc Bank Usa National Association
Bought by
Newsome Frankie
Home Financials for this Owner
Home Financials are based on the most recent Mortgage that was taken out on this home.
Original Mortgage
$44,387
Interest Rate
5.13%
Mortgage Type
New Conventional
Purchase Details
Closed on
Sep 27, 2005
Sold by
Herring George
Bought by
Harris Clarence W
Home Financials for this Owner
Home Financials are based on the most recent Mortgage that was taken out on this home.
Original Mortgage
$44,800
Interest Rate
8.5%
Mortgage Type
New Conventional
Create a Home Valuation Report for This Property
The Home Valuation Report is an in-depth analysis detailing your home's value as well as a comparison with similar homes in the area
Home Values in the Area
Average Home Value in this Area
Purchase History
| Date | Buyer | Sale Price | Title Company |
|---|---|---|---|
| Stone Ridge Rentals Llc | -- | -- | |
| Stones Development Inc | $20,000 | -- | |
| Newsome Frankie | $42,500 | -- | |
| Harris Clarence W | $56,000 | -- |
Source: Public Records
Mortgage History
| Date | Status | Borrower | Loan Amount |
|---|---|---|---|
| Previous Owner | Newsome Frankie | $44,387 | |
| Previous Owner | Harris Clarence W | $44,800 | |
| Previous Owner | Harris Clarence W | $11,200 |
Source: Public Records
Tax History Compared to Growth
Tax History
| Year | Tax Paid | Tax Assessment Tax Assessment Total Assessment is a certain percentage of the fair market value that is determined by local assessors to be the total taxable value of land and additions on the property. | Land | Improvement |
|---|---|---|---|---|
| 2024 | $591 | $17,941 | $2,258 | $15,683 |
| 2023 | $509 | $15,444 | $2,016 | $13,428 |
| 2022 | $509 | $15,444 | $2,016 | $13,428 |
| 2021 | $455 | $12,911 | $2,016 | $10,895 |
| 2020 | $455 | $12,911 | $2,016 | $10,895 |
| 2019 | $456 | $12,911 | $2,016 | $10,895 |
| 2018 | $456 | $12,911 | $2,016 | $10,895 |
| 2017 | $456 | $12,911 | $2,016 | $10,895 |
| 2016 | $457 | $12,911 | $2,016 | $10,895 |
| 2015 | $283 | $19,264 | $2,016 | $17,248 |
| 2014 | $627 | $19,264 | $2,016 | $17,248 |
| 2013 | -- | $19,264 | $2,016 | $17,248 |
Source: Public Records
Map
Nearby Homes
- 321 Spanish Moss Ln
- 806 S Forrest Ave
- 808 S Laurel Ave
- 808 Laurel Ave
- 804 S Forrest Ave
- 415 E 8th St
- 8792 Val Del Rd
- 201 E 8th St
- 322 Magnolia Dr
- 507 S Poplar St
- 211 S Gordon Ave
- 4.23AC Jm Dr
- 901 E 4th St
- 418 E 3rd St
- 304 E 3rd St
- 729 W 7th St
- 315 Newton Dr
- 800 Old Quitman Rd
- 701 Gloria St
- 11 Antioch Rd