Estimated Value: $361,173 - $405,000
3
Beds
2
Baths
1,965
Sq Ft
$199/Sq Ft
Est. Value
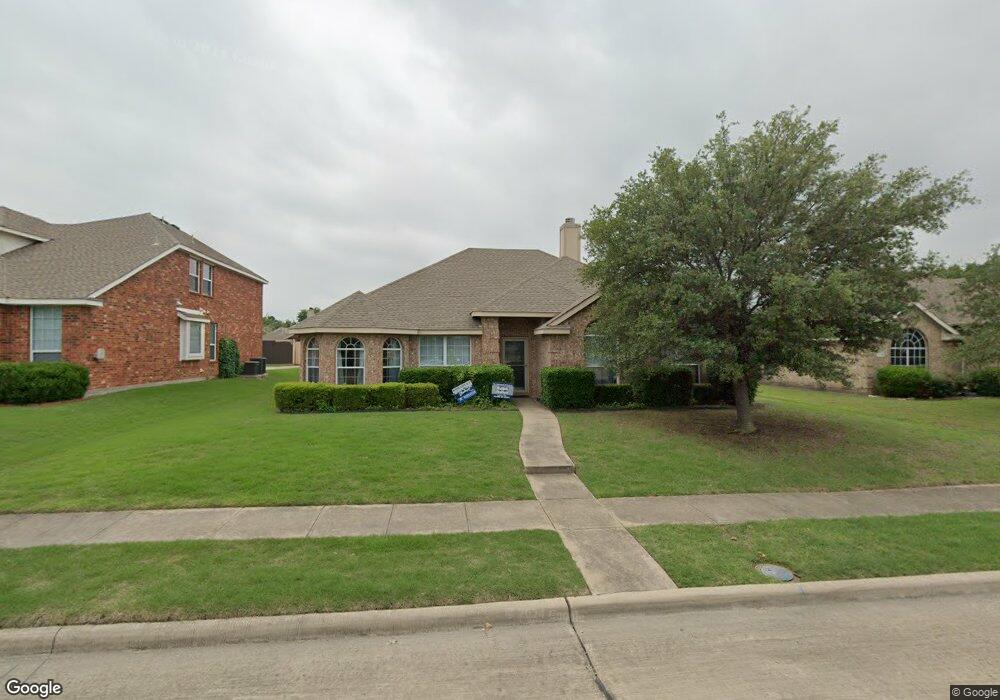
About This Home
This home is located at 1116 Destiny Ct, Wylie, TX 75098 and is currently estimated at $390,293, approximately $198 per square foot. 1116 Destiny Ct is a home located in Collin County with nearby schools including P M Akin Elementary School, AB Harrison Intermediate School, and Grady Burnett J High School.
Ownership History
Date
Name
Owned For
Owner Type
Purchase Details
Closed on
Apr 12, 2010
Sold by
Us Bank National Association
Bought by
Crawford George M and Crawford Jessica A
Current Estimated Value
Home Financials for this Owner
Home Financials are based on the most recent Mortgage that was taken out on this home.
Original Mortgage
$132,000
Outstanding Balance
$87,611
Interest Rate
4.93%
Mortgage Type
New Conventional
Estimated Equity
$302,682
Purchase Details
Closed on
Feb 2, 2010
Sold by
Teamann Christopher M
Bought by
Us Bank National Association
Purchase Details
Closed on
Dec 29, 2004
Sold by
D R Horton Texas Ltd
Bought by
Teamann Christopher
Home Financials for this Owner
Home Financials are based on the most recent Mortgage that was taken out on this home.
Original Mortgage
$124,320
Interest Rate
7.75%
Mortgage Type
Purchase Money Mortgage
Create a Home Valuation Report for This Property
The Home Valuation Report is an in-depth analysis detailing your home's value as well as a comparison with similar homes in the area
Home Values in the Area
Average Home Value in this Area
Purchase History
| Date | Buyer | Sale Price | Title Company |
|---|---|---|---|
| Crawford George M | -- | Lsi Title Agency Inc | |
| Us Bank National Association | $141,390 | None Available | |
| Teamann Christopher | -- | -- |
Source: Public Records
Mortgage History
| Date | Status | Borrower | Loan Amount |
|---|---|---|---|
| Open | Crawford George M | $132,000 | |
| Previous Owner | Teamann Christopher | $124,320 | |
| Closed | Teamann Christopher | $31,080 |
Source: Public Records
Tax History Compared to Growth
Tax History
| Year | Tax Paid | Tax Assessment Tax Assessment Total Assessment is a certain percentage of the fair market value that is determined by local assessors to be the total taxable value of land and additions on the property. | Land | Improvement |
|---|---|---|---|---|
| 2025 | $5,684 | $380,522 | $105,000 | $275,522 |
| 2024 | $5,684 | $353,553 | $105,000 | $267,912 |
| 2023 | $5,684 | $321,412 | $105,000 | $274,446 |
| 2022 | $6,410 | $292,193 | $90,000 | $242,581 |
| 2021 | $6,250 | $265,777 | $65,000 | $200,777 |
| 2020 | $5,996 | $241,482 | $65,000 | $176,482 |
| 2019 | $6,346 | $241,482 | $65,000 | $176,482 |
| 2018 | $6,093 | $226,231 | $55,000 | $171,231 |
| 2017 | $5,651 | $223,097 | $55,000 | $168,097 |
| 2016 | $5,300 | $198,465 | $40,000 | $158,465 |
| 2015 | $4,206 | $175,068 | $40,000 | $135,068 |
Source: Public Records
Map
Nearby Homes
- 1115 Nighthawk Dr
- 107 Windy Knoll Ln
- 1308 London Dr
- 312 Maltese Cir
- 1056 Fairview Dr
- 1209 Surrey Cir
- 407 Sparrow Dr
- 213 N West A Allen Blvd
- 209 Duck Blind Ave
- 205 Duck Blind Ave
- 1312 Wyndham Dr
- 211 Rutherford Ave
- 508 Weston St
- 306 Foxwood Ct
- 207 Gatwick Ct
- 1210 Troy Rd
- 2800 Gold Hill Dr
- 1201 E Stone Rd
- 1320 Cedar Branch Dr
- 1323 Canyon Creek Rd
- 1118 Destiny Ct
- 1114 Destiny Ct
- 1112 Destiny Ct
- 1121 Majestic Way
- 1123 Majestic Way
- 1119 Majestic Way
- 1201 Destiny Ct
- 1200 Destiny Ct
- 1115 Destiny Ct
- 1203 Destiny Ct
- 1110 Destiny Ct
- 1117 Majestic Way
- 1113 Destiny Ct
- 1205 Destiny Ct
- 1201 Majestic Way
- 1201 Majestic Way
- 1115 Majestic Way
- 1202 Destiny Ct
- 1111 Destiny Ct
- 1108 Destiny Ct