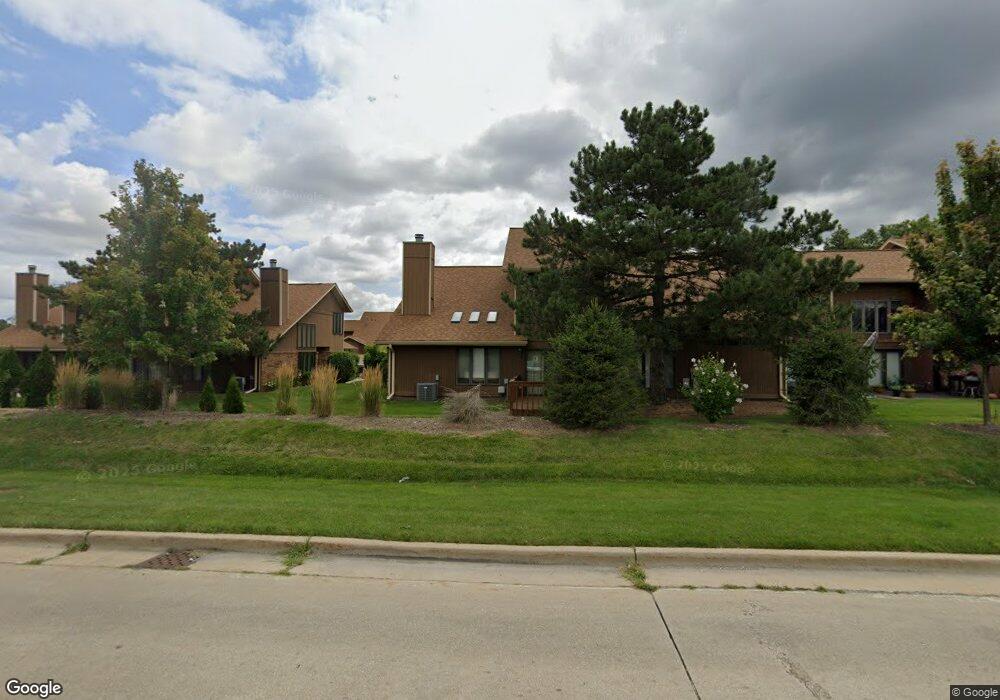
1116 Driftwood Ct Unit 81 Flossmoor, IL 60422
Estimated Value: $248,000 - $278,000
--
Bed
--
Bath
166,394
Sq Ft
$2/Sq Ft
Est. Value
About This Home
This home is located at 1116 Driftwood Ct Unit 81, Flossmoor, IL 60422 and is currently estimated at $259,986, approximately $1 per square foot. 1116 Driftwood Ct Unit 81 is a home located in Cook County with nearby schools including Heather Hill Elementary School, Parker Junior High School, and Homewood-Flossmoor High School.
Ownership History
Date
Name
Owned For
Owner Type
Purchase Details
Closed on
Jul 12, 2021
Sold by
Loving Larry C
Bought by
Loving Larry C and Larry C Loving Trust
Current Estimated Value
Purchase Details
Closed on
Jun 5, 2001
Sold by
Hoeppner Walter F and Hoeppner Vivian S
Bought by
Loving Larry
Home Financials for this Owner
Home Financials are based on the most recent Mortgage that was taken out on this home.
Original Mortgage
$155,950
Outstanding Balance
$59,665
Interest Rate
7.2%
Estimated Equity
$200,321
Purchase Details
Closed on
Jul 9, 1998
Sold by
Shi Zhan and Fan Yaling
Bought by
Hoeppner Walter F and Hoeppner Vivian S
Purchase Details
Closed on
Apr 22, 1994
Sold by
Groeneveld Susan J
Bought by
Shi Zhan and Fan Yaling
Home Financials for this Owner
Home Financials are based on the most recent Mortgage that was taken out on this home.
Original Mortgage
$136,800
Interest Rate
7.88%
Create a Home Valuation Report for This Property
The Home Valuation Report is an in-depth analysis detailing your home's value as well as a comparison with similar homes in the area
Home Values in the Area
Average Home Value in this Area
Purchase History
| Date | Buyer | Sale Price | Title Company |
|---|---|---|---|
| Loving Larry C | -- | Accommodation | |
| Loving Larry | $165,000 | -- | |
| Hoeppner Walter F | -- | -- | |
| Shi Zhan | $152,000 | -- |
Source: Public Records
Mortgage History
| Date | Status | Borrower | Loan Amount |
|---|---|---|---|
| Open | Loving Larry | $155,950 | |
| Previous Owner | Shi Zhan | $136,800 |
Source: Public Records
Tax History Compared to Growth
Tax History
| Year | Tax Paid | Tax Assessment Tax Assessment Total Assessment is a certain percentage of the fair market value that is determined by local assessors to be the total taxable value of land and additions on the property. | Land | Improvement |
|---|---|---|---|---|
| 2024 | $7,156 | $22,781 | $1,179 | $21,602 |
| 2023 | $4,601 | $22,780 | $1,178 | $21,602 |
| 2022 | $4,601 | $14,711 | $3,339 | $11,372 |
| 2021 | $4,696 | $14,710 | $3,339 | $11,371 |
| 2020 | $4,711 | $14,710 | $3,339 | $11,371 |
| 2019 | $5,136 | $15,704 | $3,142 | $12,562 |
| 2018 | $4,581 | $15,704 | $3,142 | $12,562 |
| 2017 | $4,903 | $15,704 | $3,142 | $12,562 |
| 2016 | $6,286 | $14,366 | $2,946 | $11,420 |
| 2015 | $6,249 | $14,366 | $2,946 | $11,420 |
| 2014 | $6,160 | $14,366 | $2,946 | $11,420 |
| 2013 | $5,546 | $14,236 | $2,946 | $11,290 |
Source: Public Records
Map
Nearby Homes
- 3118 Elaine Ct Unit 232
- 19020 Kedzie Ave
- 3037 Candlewood Ct
- 2931 Sunset Ave
- 2929 Flossmoor Rd
- 3232 Chestnut Dr
- 3045 Scott Crescent
- 926 Braemar Rd
- 1248 Berry Ln
- 1450 Tanglewood St Unit 1B
- 2817 Flossmoor Rd
- 1437 Woodhollow Dr
- 3533 Flossmoor Rd
- 1248 Oakmont Ave
- 1402 Berry Ln
- 1034 Central Park Ave
- 3013 Mac Heath Crescent
- 846 Park Dr
- 3007 Monterey Dr
- 1139 Leavitt Ave Unit 212
- 1120 Driftwood Ct Unit 82
- 1112 Driftwood Ct Unit 72
- 1124 Driftwood Ct Unit 83
- 1108 Driftwood Ct Unit 71
- 1128 Driftwood Ct Unit 84
- 1117 Driftwood Ct Unit 62
- 1121 Driftwood Ct Unit 61
- 1113 Driftwood Ct Unit 63
- 1109 Driftwood Ct Unit 64
- 19155 Kedzie Ave
- 3133 Driftwood Ct Unit 54
- 3133 Driftwood Ct Unit 313
- 3129 Driftwood Ct Unit 53
- 1144 Elaine Ct Unit 141
- 1130 Baythorne Dr Unit 91
- 1134 Baythorne Dr Unit 92
- 3125 Driftwood Ct Unit 52
- 1145 Elaine Ct Unit 132
- 1148 Elaine Ct Unit 142
- 3121 Driftwood Ct Unit 51