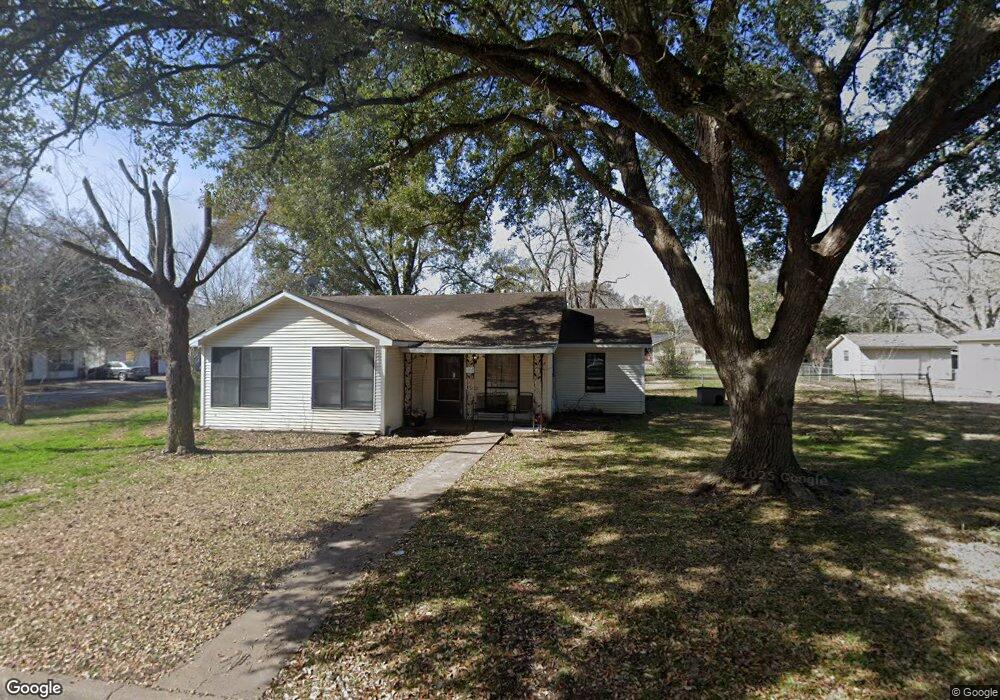
1116 George St Rosenberg, TX 77471
Estimated Value: $191,000 - $255,284
3
Beds
4
Baths
1,478
Sq Ft
$155/Sq Ft
Est. Value
About This Home
This home is located at 1116 George St, Rosenberg, TX 77471 and is currently estimated at $228,428, approximately $154 per square foot. 1116 George St is a home located in Fort Bend County with nearby schools including Bowie Elementary School, Navarro Middle School, and George Junior High School.
Ownership History
Date
Name
Owned For
Owner Type
Purchase Details
Closed on
Jan 4, 2005
Sold by
Leonard Daryl E and Leonard Becky L
Bought by
Ramos Herminia H
Current Estimated Value
Home Financials for this Owner
Home Financials are based on the most recent Mortgage that was taken out on this home.
Original Mortgage
$35,000
Outstanding Balance
$17,659
Interest Rate
5.74%
Mortgage Type
Seller Take Back
Estimated Equity
$210,769
Purchase Details
Closed on
Nov 20, 1985
Sold by
Heitman Willie
Bought by
Ramos Herminia H
Create a Home Valuation Report for This Property
The Home Valuation Report is an in-depth analysis detailing your home's value as well as a comparison with similar homes in the area
Home Values in the Area
Average Home Value in this Area
Purchase History
| Date | Buyer | Sale Price | Title Company |
|---|---|---|---|
| Ramos Herminia H | -- | Chicago Title Insurance Comp | |
| Ramos Herminia H | -- | -- |
Source: Public Records
Mortgage History
| Date | Status | Borrower | Loan Amount |
|---|---|---|---|
| Open | Ramos Herminia H | $35,000 |
Source: Public Records
Tax History Compared to Growth
Tax History
| Year | Tax Paid | Tax Assessment Tax Assessment Total Assessment is a certain percentage of the fair market value that is determined by local assessors to be the total taxable value of land and additions on the property. | Land | Improvement |
|---|---|---|---|---|
| 2025 | $5,011 | $251,360 | $131,672 | $119,688 |
| 2024 | $5,011 | $279,082 | $131,672 | $147,410 |
| 2023 | $4,268 | $221,082 | $67,629 | $153,453 |
| 2022 | $3,961 | $193,400 | $67,630 | $125,770 |
| 2021 | $3,918 | $188,830 | $75,430 | $113,400 |
| 2020 | $3,968 | $186,980 | $83,410 | $103,570 |
| 2019 | $3,628 | $158,830 | $39,170 | $119,660 |
| 2018 | $2,972 | $128,030 | $39,170 | $88,860 |
| 2017 | $2,808 | $120,310 | $39,170 | $81,140 |
| 2016 | $2,579 | $110,510 | $39,170 | $71,340 |
| 2015 | $2,483 | $105,820 | $39,170 | $66,650 |
| 2014 | $2,016 | $98,840 | $39,170 | $59,670 |
Source: Public Records
Map
Nearby Homes
- 1112 James St
- 3326 Tilley Dr
- 805 Avenue J
- 1220 Mulcahy St
- 614 Mulcahy St
- 1210 Avenue E
- 1400 Dyer Ave
- 735 Willow St
- 1418 Carlisle St
- 2606 Wastelbread Ln
- 2523 Good Morrow Dr
- 2527 Good Morrow Dr
- 2622 Good Morrow Dr
- 2507 Good Morrow Dr
- 2614 Good Morrow Dr
- 503 Willow St
- 915 Avenue E
- 1613 Mulcahy St
- 428 West St
- 1605 Walnut Ave