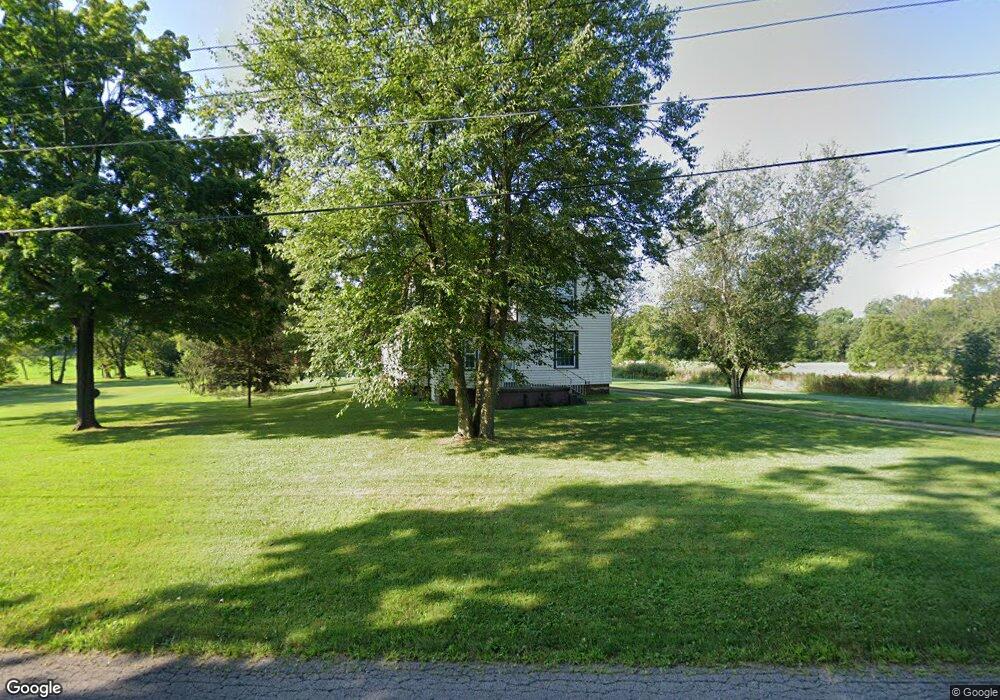
1116 Hickory Ln Mansfield, OH 44905
Estimated Value: $154,000 - $342,762
3
Beds
2
Baths
1,742
Sq Ft
$134/Sq Ft
Est. Value
About This Home
This home is located at 1116 Hickory Ln, Mansfield, OH 44905 and is currently estimated at $232,691, approximately $133 per square foot. 1116 Hickory Ln is a home with nearby schools including Madison High School, Temple-Christian School, and St. Peter's Elementary/Montessori School.
Ownership History
Date
Name
Owned For
Owner Type
Purchase Details
Closed on
Nov 18, 2019
Sold by
Chaffie Selina D
Bought by
Chaffin Darlene B and Chaffin Keith B
Current Estimated Value
Purchase Details
Closed on
Oct 26, 2004
Sold by
Chaffin Donald and Chaffin Darlene B
Bought by
Chaffin Donald and Chaffin Darlene B
Purchase Details
Closed on
Nov 14, 2003
Sold by
Mccammon Chris A and Roth Joan L
Bought by
Chaffin Donald and Chaffin Darlene B
Home Financials for this Owner
Home Financials are based on the most recent Mortgage that was taken out on this home.
Original Mortgage
$105,000
Outstanding Balance
$42,535
Interest Rate
4.2%
Mortgage Type
Purchase Money Mortgage
Estimated Equity
$190,156
Purchase Details
Closed on
Aug 16, 1994
Sold by
Wiley Robert F
Bought by
Mccammon Chris A
Home Financials for this Owner
Home Financials are based on the most recent Mortgage that was taken out on this home.
Original Mortgage
$80,000
Interest Rate
8.16%
Mortgage Type
New Conventional
Create a Home Valuation Report for This Property
The Home Valuation Report is an in-depth analysis detailing your home's value as well as a comparison with similar homes in the area
Home Values in the Area
Average Home Value in this Area
Purchase History
| Date | Buyer | Sale Price | Title Company |
|---|---|---|---|
| Chaffin Darlene B | -- | None Available | |
| Chaffin Donald | -- | -- | |
| Chaffin Donald | $175,000 | Chicago Title | |
| Mccammon Chris A | $100,000 | -- |
Source: Public Records
Mortgage History
| Date | Status | Borrower | Loan Amount |
|---|---|---|---|
| Open | Chaffin Donald | $105,000 | |
| Previous Owner | Mccammon Chris A | $80,000 |
Source: Public Records
Tax History Compared to Growth
Tax History
| Year | Tax Paid | Tax Assessment Tax Assessment Total Assessment is a certain percentage of the fair market value that is determined by local assessors to be the total taxable value of land and additions on the property. | Land | Improvement |
|---|---|---|---|---|
| 2024 | $2,489 | $77,980 | $44,820 | $33,160 |
| 2023 | $2,489 | $77,980 | $44,820 | $33,160 |
| 2022 | $2,173 | $60,030 | $33,840 | $26,190 |
| 2021 | $2,173 | $60,030 | $33,840 | $26,190 |
| 2020 | $2,185 | $60,030 | $33,840 | $26,190 |
| 2019 | $2,533 | $54,390 | $28,200 | $26,190 |
| 2018 | $2,372 | $54,390 | $28,200 | $26,190 |
| 2017 | $1,827 | $45,850 | $28,200 | $17,650 |
| 2016 | $2,319 | $43,360 | $25,540 | $17,820 |
| 2015 | $2,319 | $43,360 | $25,540 | $17,820 |
| 2014 | $2,205 | $43,360 | $25,540 | $17,820 |
| 2012 | $808 | $39,100 | $21,280 | $17,820 |
Source: Public Records
Map
Nearby Homes
- 36 Ridge Rd S
- 28 Stewart Rd N
- 953 Park Ave E
- 62 Bahl Ave
- 780 Park Ave E
- 419 Pearl Ave
- 0 Madison Rd
- 1303 Park Ave E
- 291 Stewart Rd N
- 0 State Route 39 & I-71 Southeast Quadrant
- 0 Smith Ave
- 0 State Route 39 & I-71 Northeast Quadrant
- 0 Mcelroy Rd
- 716 Mansfield Washington Rd
- 326 Terrace Dr
- 794 Mansfield Washington Rd
- 405 Plainview Ave
- 370 Illinois Ave N
- 76 Ford Rd N Unit 20
- 76 Ford Rd N
- 1115 Hickory Ln
- 1125 Hickory Ln
- 1135 Hickory Ln
- 1143 Hickory Ln
- 1107 Hickory Ln
- 1086 Hickory Ln
- 1091 Hickory Ln
- 1039 Hickory Ln
- 1230 Lucas Rd
- 1202 Lucas Rd
- 1246 S Lexington Springmill Rd
- 1200 Lucas Rd
- 1280 Hickory Ln
- 1194 Lucas Rd
- 1188 Lucas Rd
- 1142 Lucas Rd
- 1235 Lucas Rd
- 1261 Lucas Rd
- 1241 Lucas Rd
- 1229 Lucas Rd