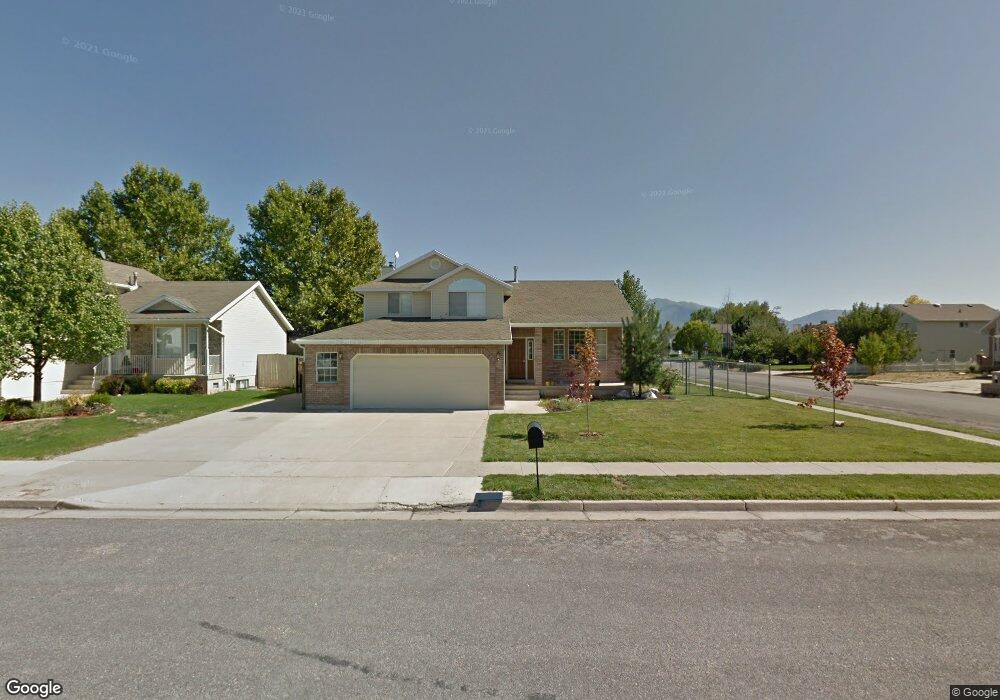
1116 N 2775 W Layton, UT 84041
Estimated Value: $495,000 - $518,000
3
Beds
3
Baths
2,292
Sq Ft
$221/Sq Ft
Est. Value
About This Home
This home is located at 1116 N 2775 W, Layton, UT 84041 and is currently estimated at $505,565, approximately $220 per square foot. 1116 N 2775 W is a home located in Davis County with nearby schools including Legacy Junior High School, Layton High School, and North Davis Preparatory Academy.
Ownership History
Date
Name
Owned For
Owner Type
Purchase Details
Closed on
Apr 27, 2021
Sold by
Tolman Jordan M
Bought by
Tolman Jami L
Current Estimated Value
Home Financials for this Owner
Home Financials are based on the most recent Mortgage that was taken out on this home.
Original Mortgage
$245,800
Outstanding Balance
$221,928
Interest Rate
3%
Mortgage Type
New Conventional
Estimated Equity
$283,637
Purchase Details
Closed on
Jul 22, 2011
Sold by
Allison Michael and Allison Michael B
Bought by
Tolman Jordan M and Tolman Jami L
Home Financials for this Owner
Home Financials are based on the most recent Mortgage that was taken out on this home.
Original Mortgage
$170,050
Interest Rate
4.46%
Mortgage Type
New Conventional
Purchase Details
Closed on
Jun 24, 1999
Sold by
Tippetts Troy and Tippetts Tiffany
Bought by
Allison Michael and Allison Pamela
Home Financials for this Owner
Home Financials are based on the most recent Mortgage that was taken out on this home.
Original Mortgage
$162,000
Interest Rate
9.8%
Create a Home Valuation Report for This Property
The Home Valuation Report is an in-depth analysis detailing your home's value as well as a comparison with similar homes in the area
Home Values in the Area
Average Home Value in this Area
Purchase History
| Date | Buyer | Sale Price | Title Company |
|---|---|---|---|
| Tolman Jami L | -- | Hickman Land Title Co | |
| Tolman Jordan M | -- | Metro National Title | |
| Allison Michael | -- | Security Title Company |
Source: Public Records
Mortgage History
| Date | Status | Borrower | Loan Amount |
|---|---|---|---|
| Open | Tolman Jami L | $245,800 | |
| Closed | Tolman Jordan M | $170,050 | |
| Previous Owner | Allison Michael | $162,000 |
Source: Public Records
Tax History Compared to Growth
Tax History
| Year | Tax Paid | Tax Assessment Tax Assessment Total Assessment is a certain percentage of the fair market value that is determined by local assessors to be the total taxable value of land and additions on the property. | Land | Improvement |
|---|---|---|---|---|
| 2025 | $2,463 | $258,500 | $100,900 | $157,600 |
| 2024 | $2,372 | $250,800 | $112,524 | $138,276 |
| 2023 | $2,253 | $420,000 | $109,529 | $310,471 |
| 2022 | $2,462 | $249,150 | $69,722 | $179,428 |
| 2021 | $2,233 | $337,000 | $104,616 | $232,384 |
| 2020 | $2,009 | $291,000 | $87,651 | $203,349 |
| 2019 | $1,946 | $276,000 | $90,994 | $185,006 |
| 2018 | $1,749 | $249,000 | $79,689 | $169,311 |
| 2016 | $1,633 | $119,955 | $30,770 | $89,185 |
| 2015 | $1,542 | $107,525 | $30,770 | $76,755 |
| 2014 | $1,523 | $108,574 | $30,770 | $77,804 |
| 2013 | -- | $101,808 | $28,952 | $72,856 |
Source: Public Records
Map
Nearby Homes