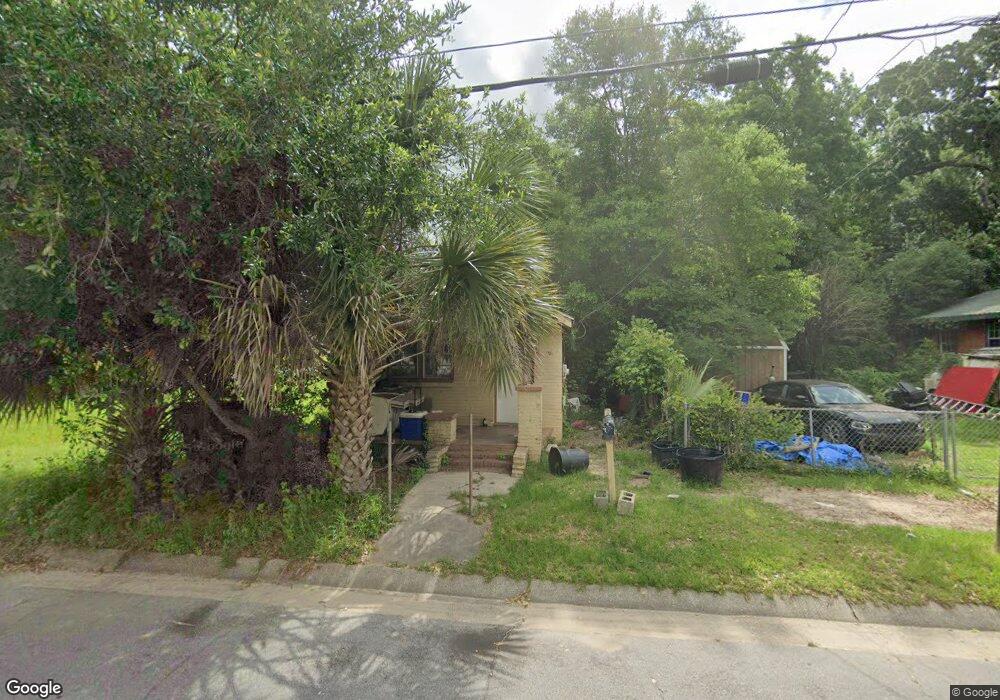
1116 N J St Pensacola, FL 32501
Estimated Value: $70,853 - $139,000
--
Bed
1
Bath
850
Sq Ft
$133/Sq Ft
Est. Value
About This Home
This home is located at 1116 N J St, Pensacola, FL 32501 and is currently estimated at $112,713, approximately $132 per square foot. 1116 N J St is a home located in Escambia County with nearby schools including Warrington Middle School, Pensacola High School, and Escambia Christian School.
Ownership History
Date
Name
Owned For
Owner Type
Purchase Details
Closed on
Feb 26, 2018
Sold by
Kleinatland Robert
Bought by
Chester Ashley Kandice E
Current Estimated Value
Purchase Details
Closed on
Jun 8, 2016
Sold by
Usa Meri Bank
Bought by
Cope Joanna
Purchase Details
Closed on
Jun 1, 2016
Bought by
Kleinatland Robert
Purchase Details
Closed on
Mar 3, 2016
Sold by
Cope Joanna
Bought by
Kleinatland Robert
Purchase Details
Closed on
Mar 7, 2014
Sold by
Magnolia Tc 2 Llc
Bought by
Cope Joanna
Purchase Details
Closed on
Dec 31, 2013
Sold by
Cromartie Ernest and Cromartie Velma Lee
Bought by
Usameribank
Create a Home Valuation Report for This Property
The Home Valuation Report is an in-depth analysis detailing your home's value as well as a comparison with similar homes in the area
Home Values in the Area
Average Home Value in this Area
Purchase History
| Date | Buyer | Sale Price | Title Company |
|---|---|---|---|
| Chester Ashley Kandice E | $8,000 | Attorney | |
| Cope Joanna | -- | None Available | |
| Kleinatland Robert | $100 | -- | |
| Kleinatland Robert | $8,000 | None Available | |
| Cope Joanna | $4,750 | None Available | |
| Usameribank | $4,701 | None Available |
Source: Public Records
Tax History Compared to Growth
Tax History
| Year | Tax Paid | Tax Assessment Tax Assessment Total Assessment is a certain percentage of the fair market value that is determined by local assessors to be the total taxable value of land and additions on the property. | Land | Improvement |
|---|---|---|---|---|
| 2024 | $748 | $44,092 | $9,533 | $34,559 |
| 2023 | $748 | $42,246 | $9,533 | $32,713 |
| 2022 | $694 | $38,722 | $9,533 | $29,189 |
| 2021 | $36 | $25,121 | $0 | $0 |
| 2020 | $32 | $24,775 | $0 | $0 |
| 2019 | $32 | $24,218 | $0 | $0 |
| 2018 | $433 | $22,739 | $0 | $0 |
| 2017 | $411 | $21,160 | $0 | $0 |
| 2016 | $426 | $21,686 | $0 | $0 |
| 2015 | $431 | $21,655 | $0 | $0 |
| 2014 | $416 | $20,722 | $0 | $0 |
Source: Public Records
Map
Nearby Homes